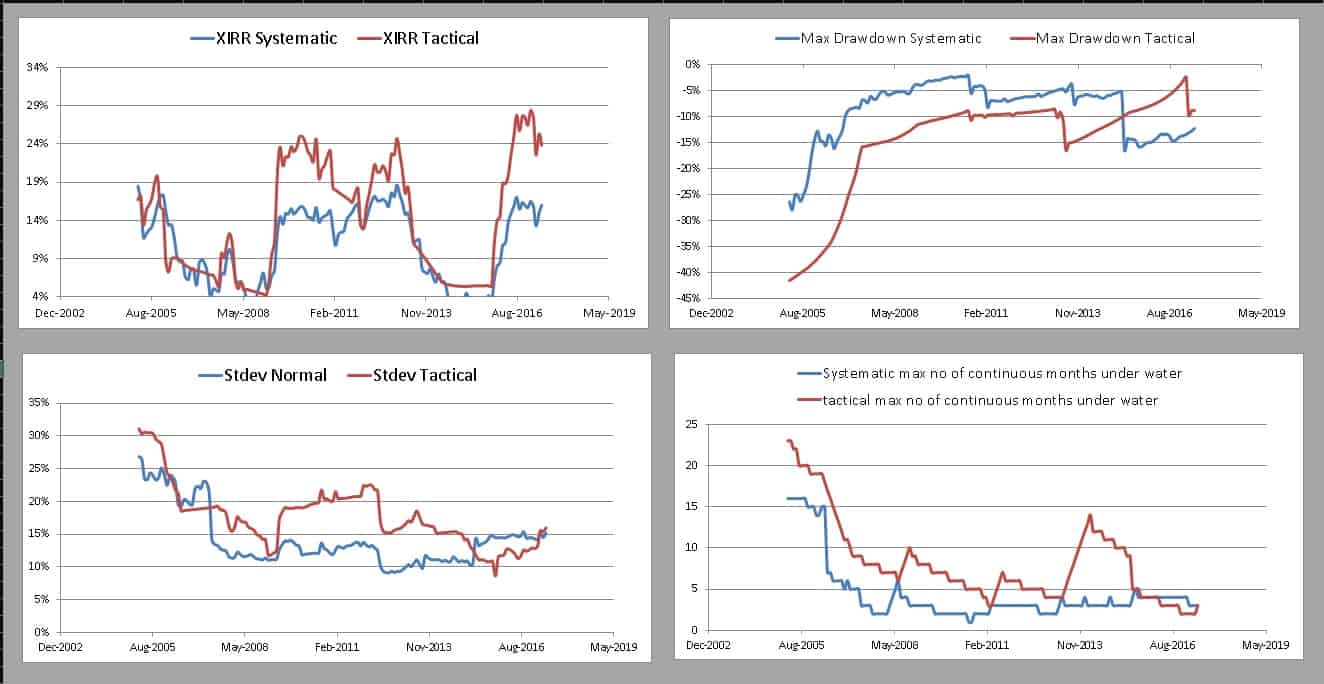
In the fourth and final part of our double moving average market timing model backtests, we consider Sensex and other Indian Indices. We have already established that the model reasonably works (see links below) with Indian gilts, Nasdaq 100, the S&P 500 and gold. Our primary goal in this updated study is to illustrate market-specific risks and the sequence of returns risk with market timing.
Previous episodes in this series:
- Is it possible to time entry and exit from gilt mutual funds for better returns?
- Testing a double moving average market timing model (part 1): Nasdaq 100
- Testing a double moving average market timing model with S&P 500 (Part 2)
- Testing a double moving average market timing model with gold (Part 3)
We shall use Sensex price data from April 1979 and either a fixed return debt instrument offering 6% a year or I-bex gilt index.
Systematic investing: A sum is invested each month in equity and debt. We shall consider 50% equity and 50% debt over 5 years, 10 years and 15 years. The portfolio is rebalanced annually. Taxes and exit loads due to this are not considered.
Tactical investing: If the six -months moving average (6MMA) of the S&P 500 is greater than the 12-month moving average (12MMA) then all debt holdings are sold and invested in equity. All future investments are also made in equity.
🔥Secure your future with our Robo-advisory tool trusted by over 3,500 investors and advisors. From effortless retirement planning to funding your children’s biggest dreams, turn your financial goals into reality. 🔥
Subscribe for money management solutions via email! (Link takes you to our email sign-up form) Join 32,000+ readers in our community.
👉 New Tool Alert! NaviPlan: A Privacy-Focused Multi-asset Tracker and Goal Planner 👈
If 6MMA < 12 MMA, then all equity holdings are sold and invested in debt. All future investments are also made in debt. Tax and exit load due to the switches are not considered. However, typically the average number of switches is lesser than annual rebalancing. For example, the no of buy/sell switches over 5 years is only about twice on average; is about 4 on average over 10 years; and about 5 on average over 15 years.
This is one such run over the last 15-years.
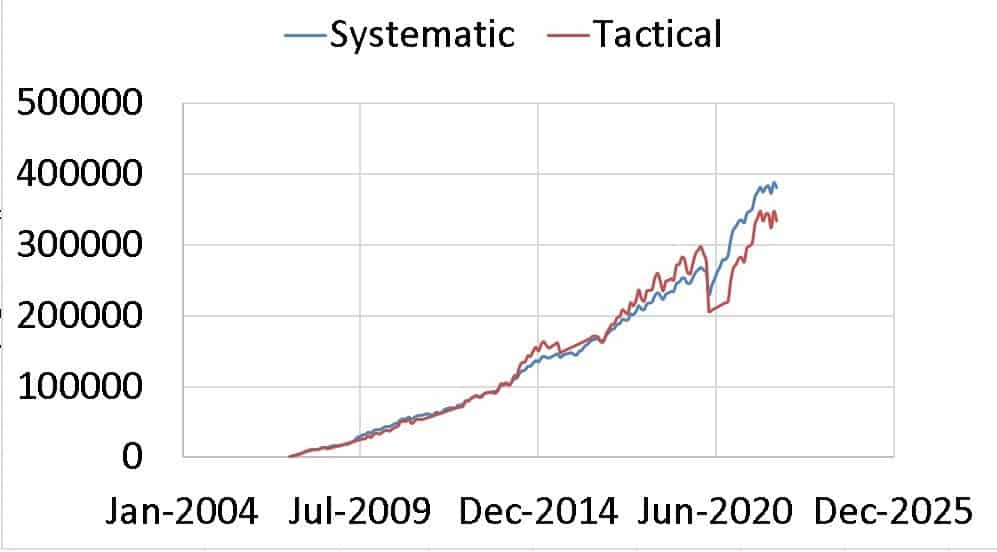
Notice that the tactical strategy fails badly. The reason for this becomes clear if we look at the moving averages.
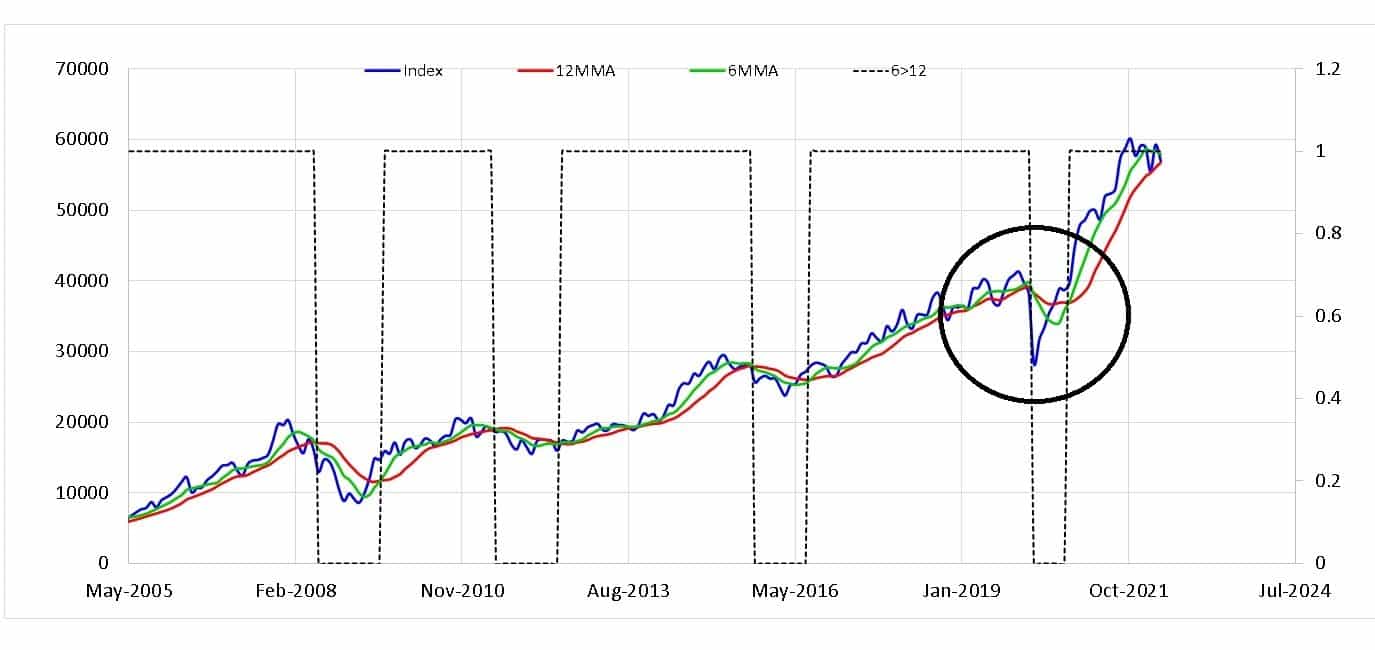
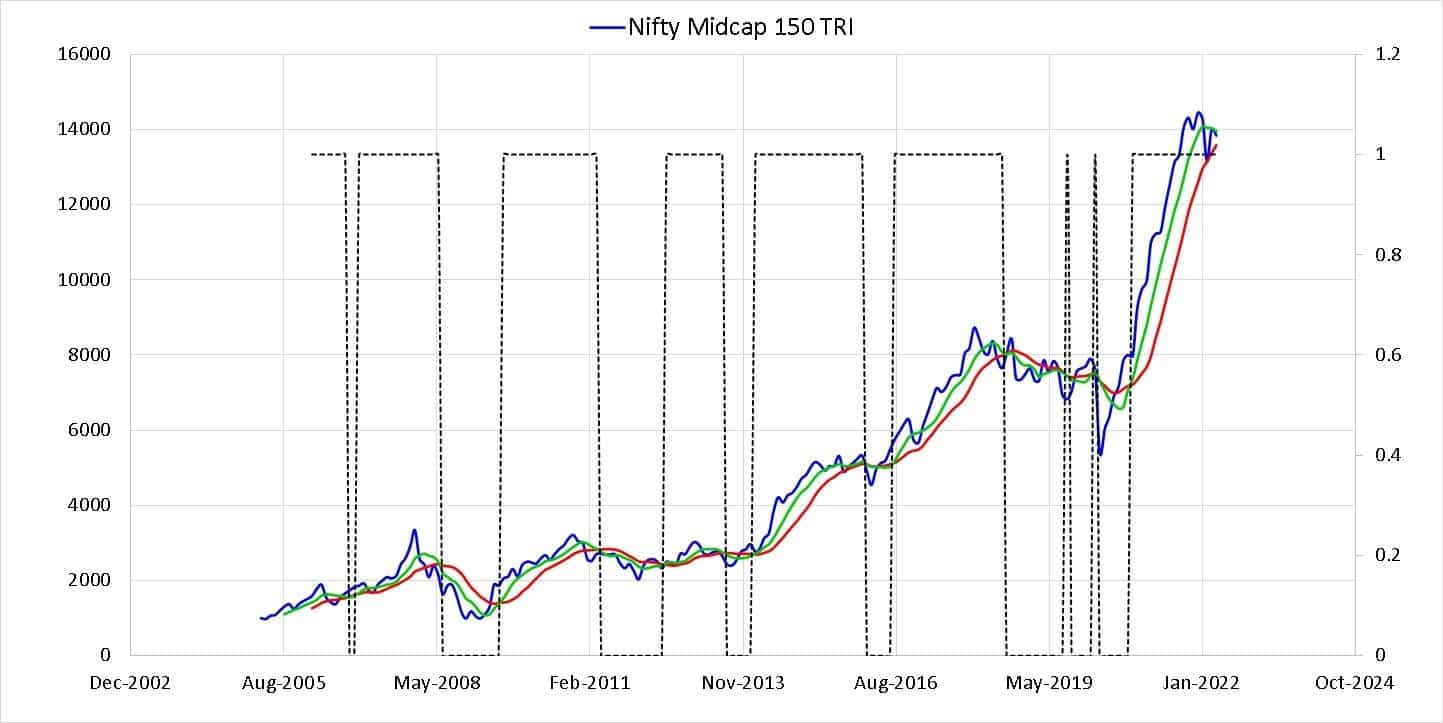
The March 2020 crash was short-lived (compared to the 2008 crash) but it was quite sharp. See: Sensex loses 30% twice as fast as 2008 crash! The price has never moved above or below both moving averages as it did during March 2020.
Because of this a longer time was spent holding cash and chunk of the recovery accessible to the systematic investor could not be enjoyed by the tactical investor.
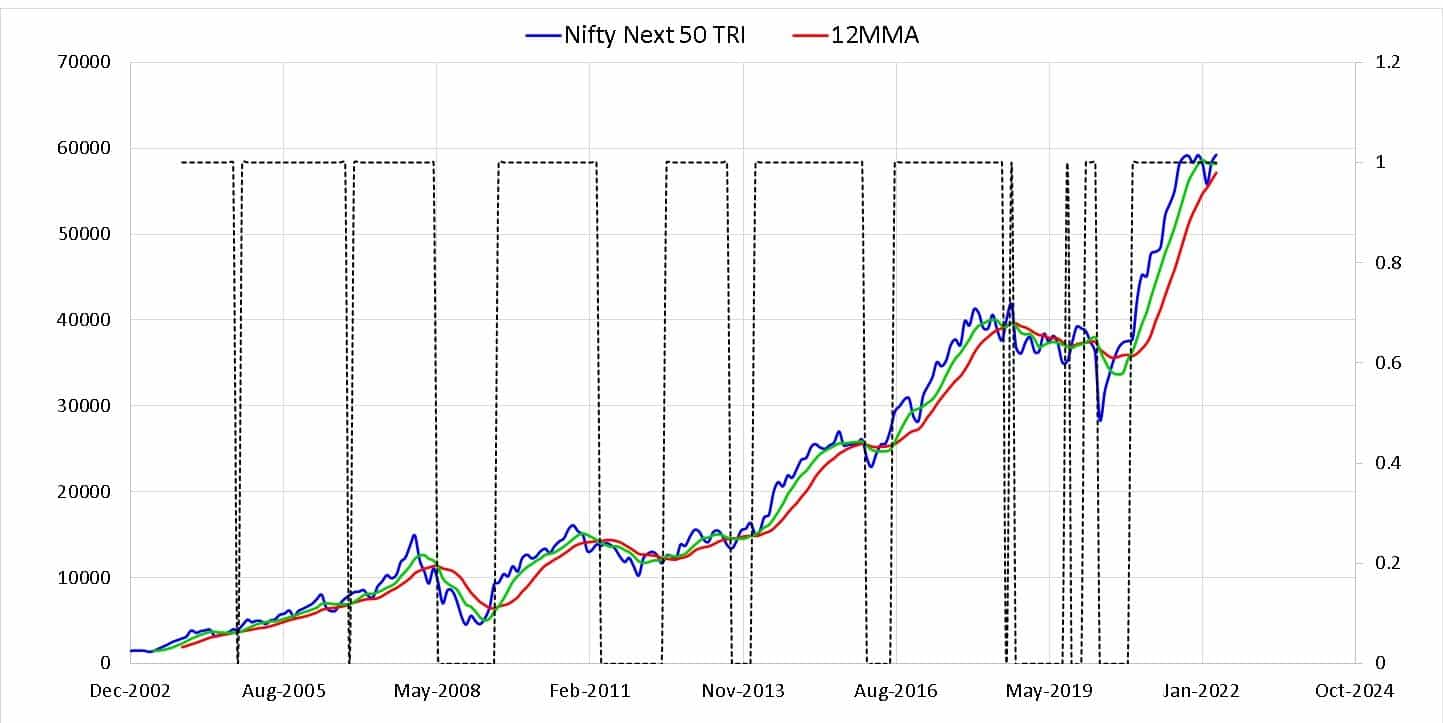
Similar trends are also seen with Nifty Next 50.
With Nifty Midcap 150.
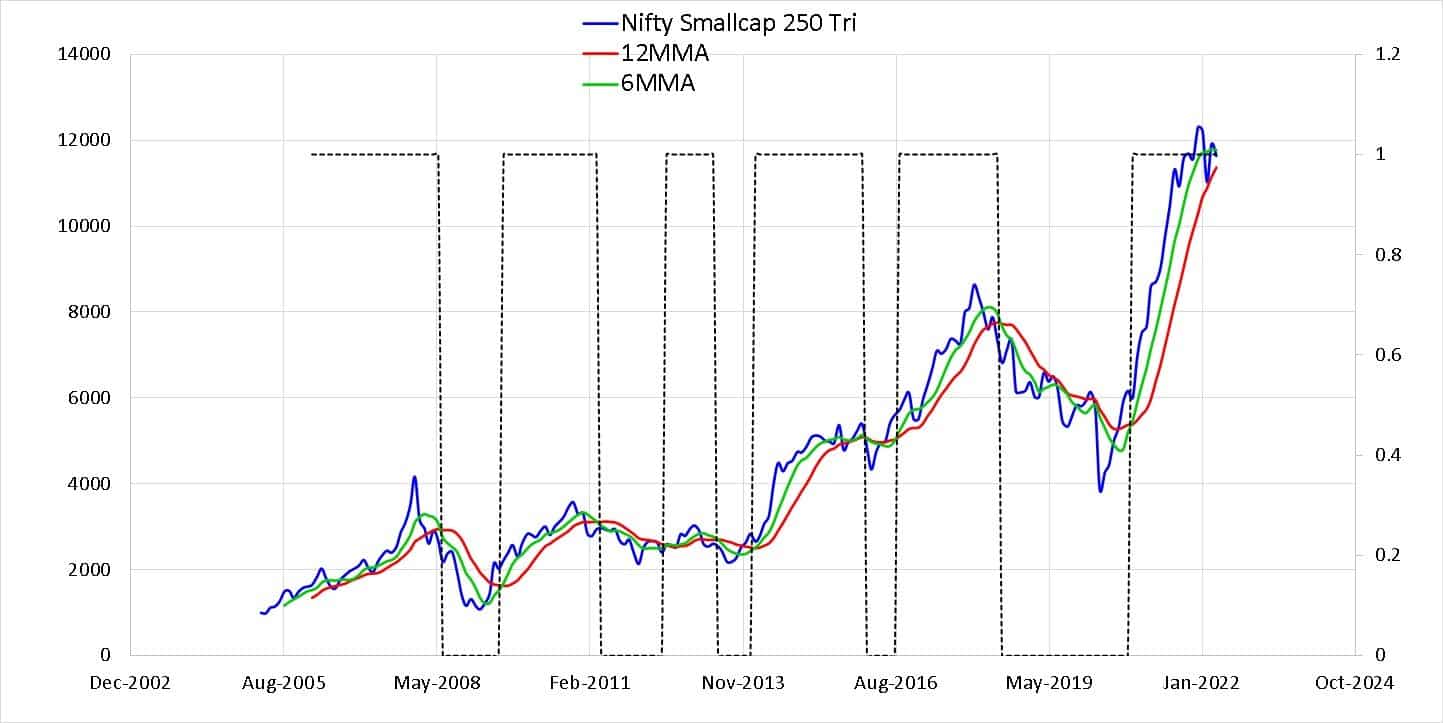
And Nifty SMallcap 250 (although relatively lesser).
However, this is not seen in the S&P 500 (or the Nasdaq 100 TRI, not shown).
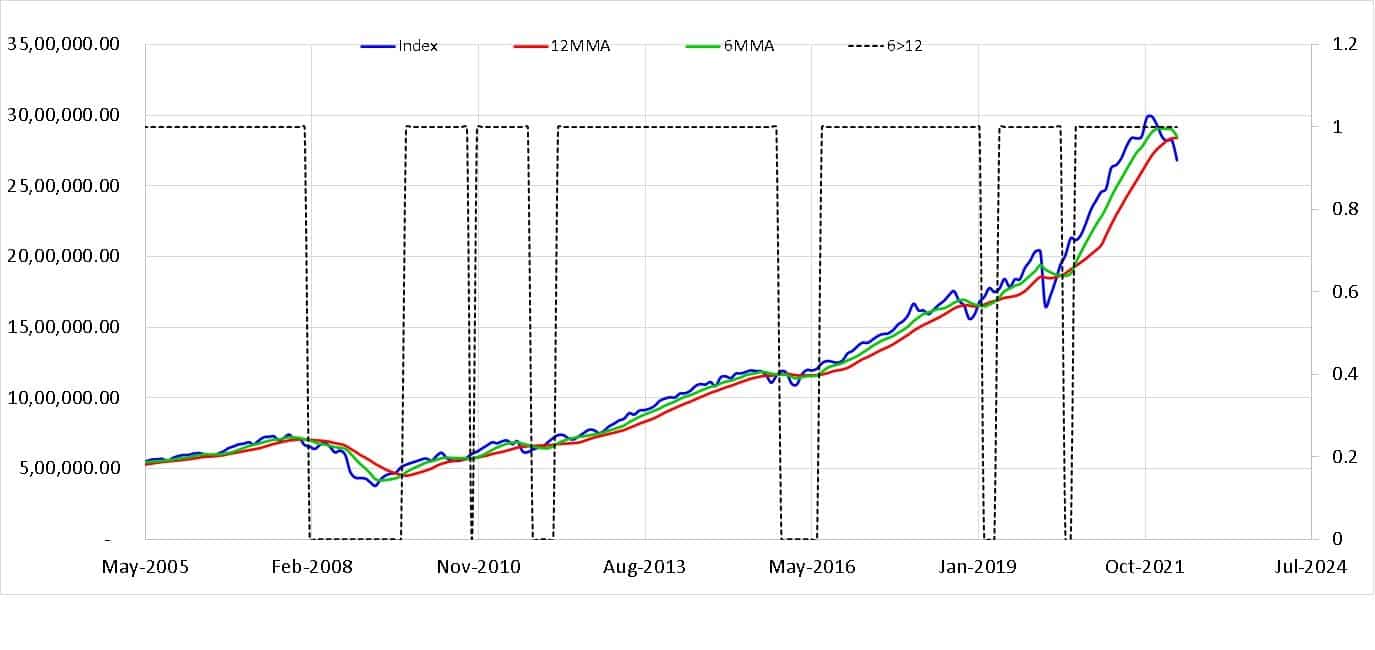
This has important consequences. If you look at the data over 15 years published for the S&P 500 or the Nasdaq 100, the tactical strategy does not fail spectacularly anywhere.
S&P 500: In fact, the tactical strategy continues to hold sway through the March 2020 crash and beyond.
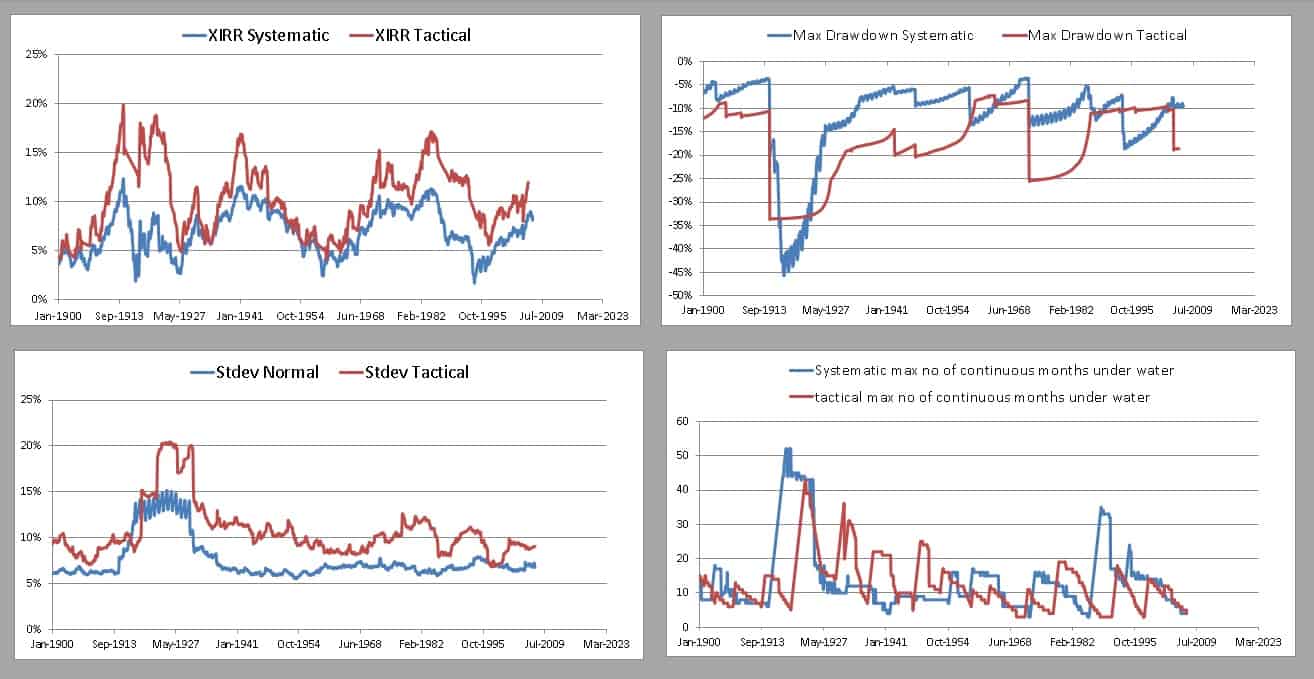
Sensex: The dramatic underperformance after the march 2020 crash can be clearly seen in the left image of the top panel.
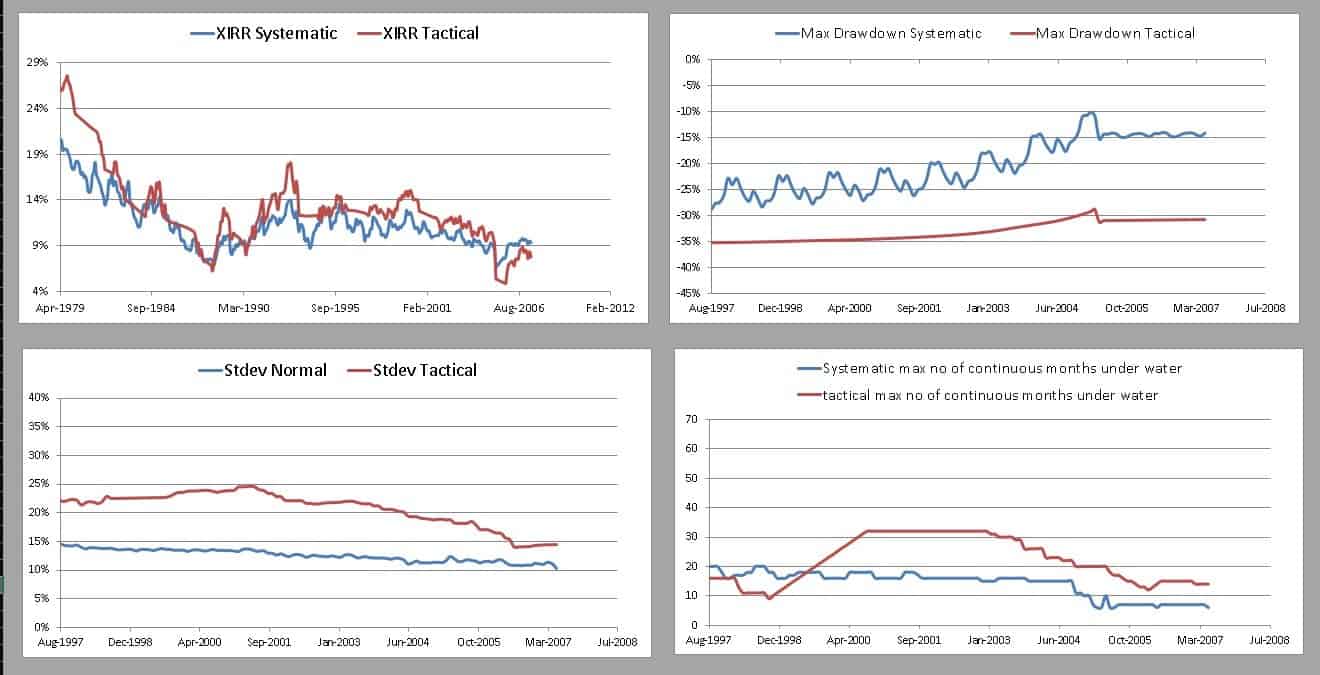
The 20-year data does not look as bad but that is cold comfort.
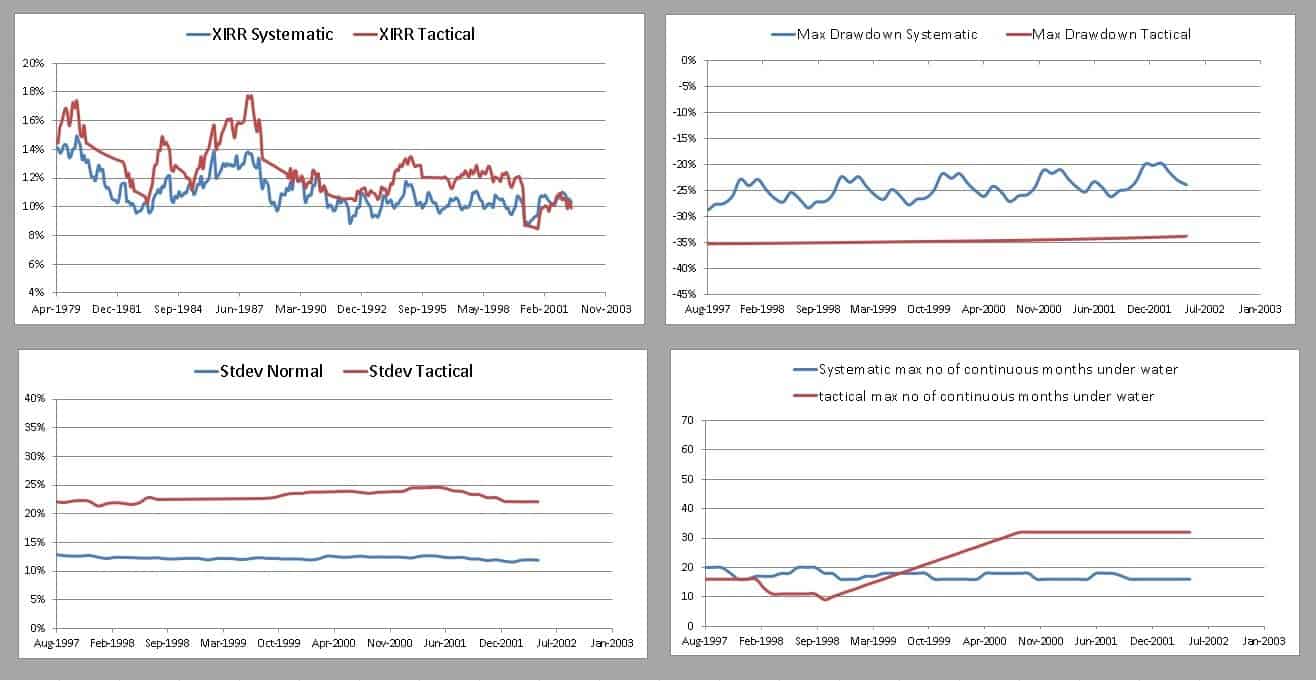
So what is the takeaway here? We already knew it will not work all the time. A particular sequence of returns involving a market crash and a sudden price deviation has made it clear that the double moving average tactical strategy can fail spectacularly.
This particular sequence of return was not observed over 122 years of the S&P 500 data! This is why it is important to appreciate the limitations of backtesting tactical (or systematic) strategies.
What works for one asset allocation may not work for others (as we showed for 70% equity compared to 50% equity). What works for one market need not work for all others. What worked in the past need not work in future as we have no idea how the future sequence of returns will pan out.
It must be understood that sequence of returns is common to both systematic and tactical strategies. When they tell us “past performance is not indicative of future performance”, they mean it! And they have precisely sequence of returns in mind. Also see: Want to be financially free? Do not count on frugality! Worry about sequence of returns risk!
Note: The method fails across March 2020 for Sensex (which is similar to Nifty 50), Nifty Next 50 and Nidty Midcap 150 but does not fail for Nifty Small cap 250! See grapshs in the appendix below. Again that reiterates that the method is not special and can arbitrarily win or lose.
It is this arbitrary nature of the method that investors should be wary about. Those who believe in this mehod or their like should be ready to play it by ear and counter large deviations in real time. This is easier said than done.
Does this mean the double moving average strategy has failed? We have shown that it can fail bigger than ever seen before. From analysts point of view, I dont think it can be called a failure. Just that it has fallen in line with nothing works all the time in all markets.
From an investors’ point of view, any strategy is a gamble including a SIP. For example, a SIP in a small cap fund over the long term has the highest uncertainty. See Why a SIP in Small Cap Mutual Funds is a waste of money and time.
This particular tractical strategy comes with higher risks and that may or may not pay off. It can be used by those who do not mind taking the risk. Just that they need to be wary of the price deviating too much from the averages. Most investors’ choose one strategy, tell themselves that that have chosen the best path and never bother to compare for they are afriad of what they might see!
Does this mean systematic investing is the best? No. It is just another method sometimes superior to other methods and sometimes inferior. We will never know when we start investing. It is a leap of faith.
That’s it for this series! Thank you for your patience. Additional results are presented in the appendix below.
Appendix
Sensex 15 year and 70% equity.
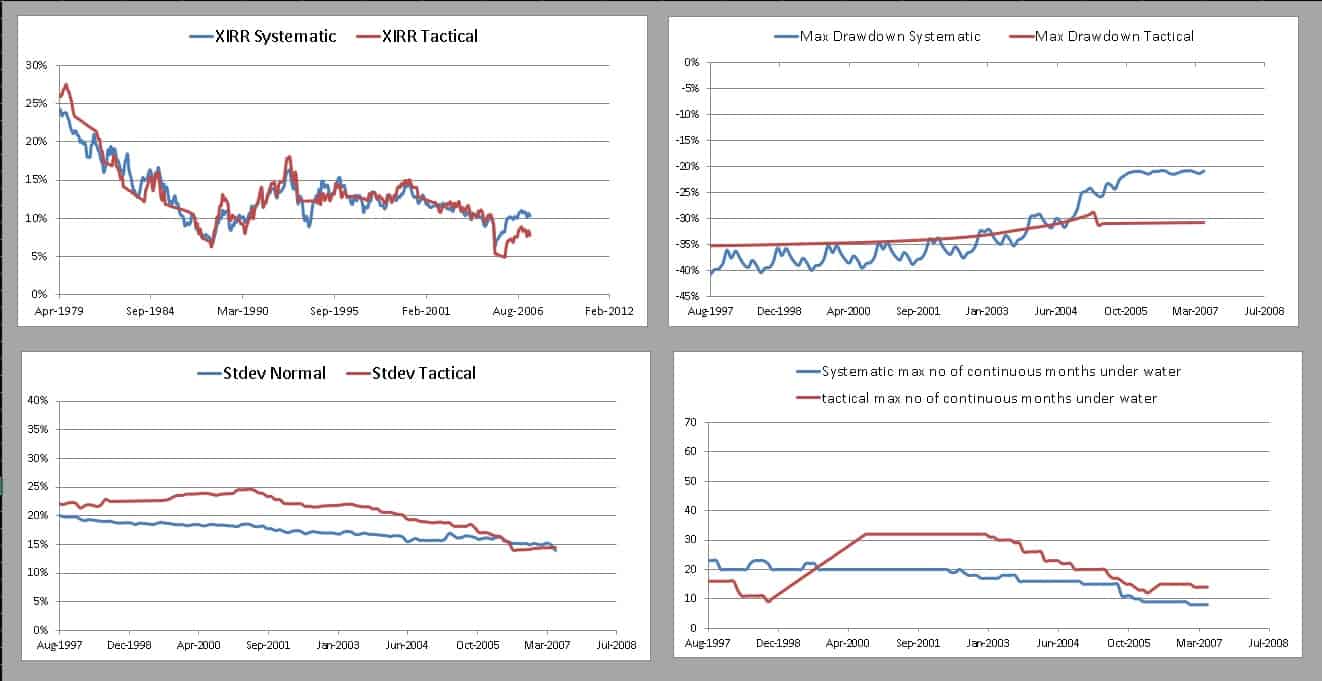
Sensex 10 years; 50% equity
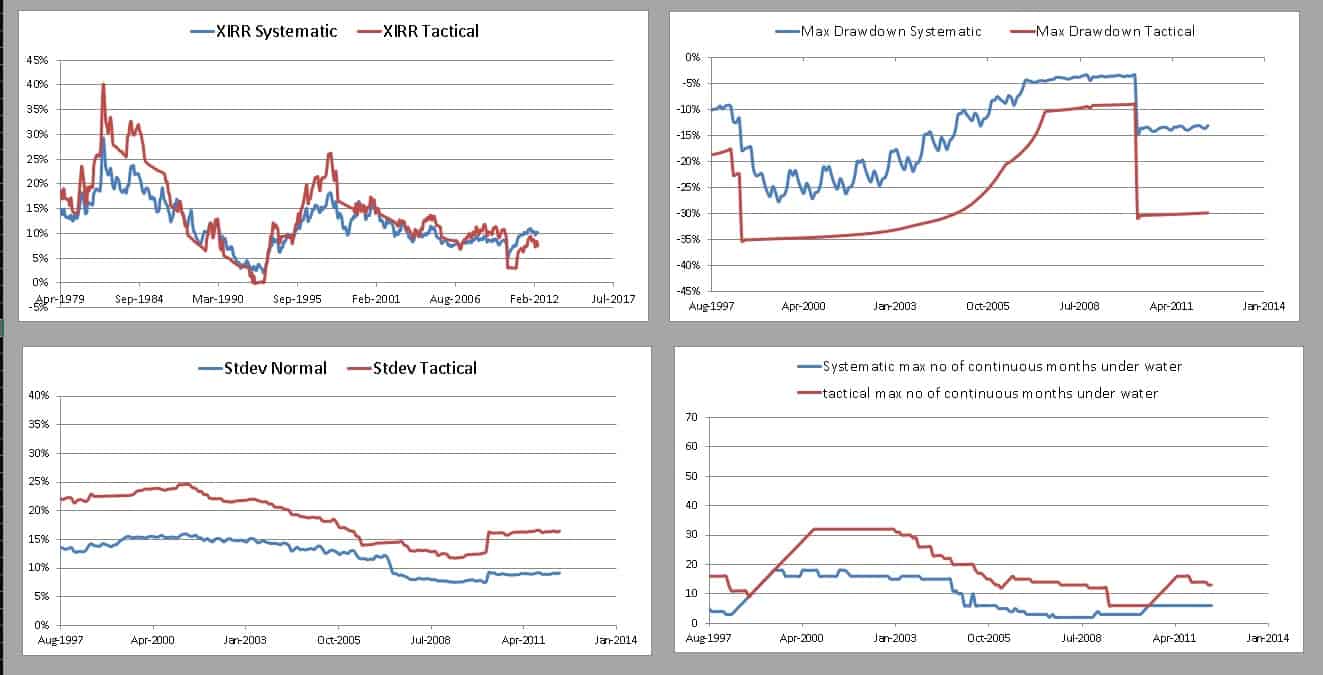
Nifty Next 50; 15 years; 50% equity
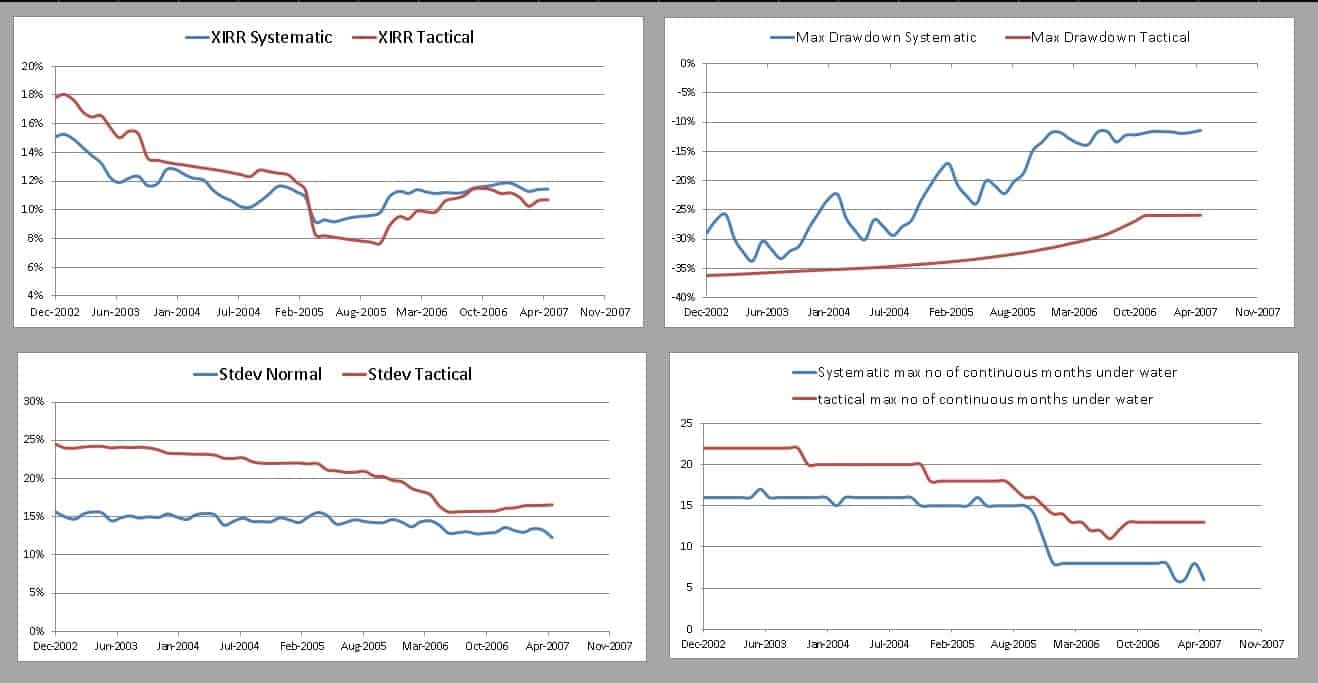
Nifty Midcap 150; 10 years; 50% equity
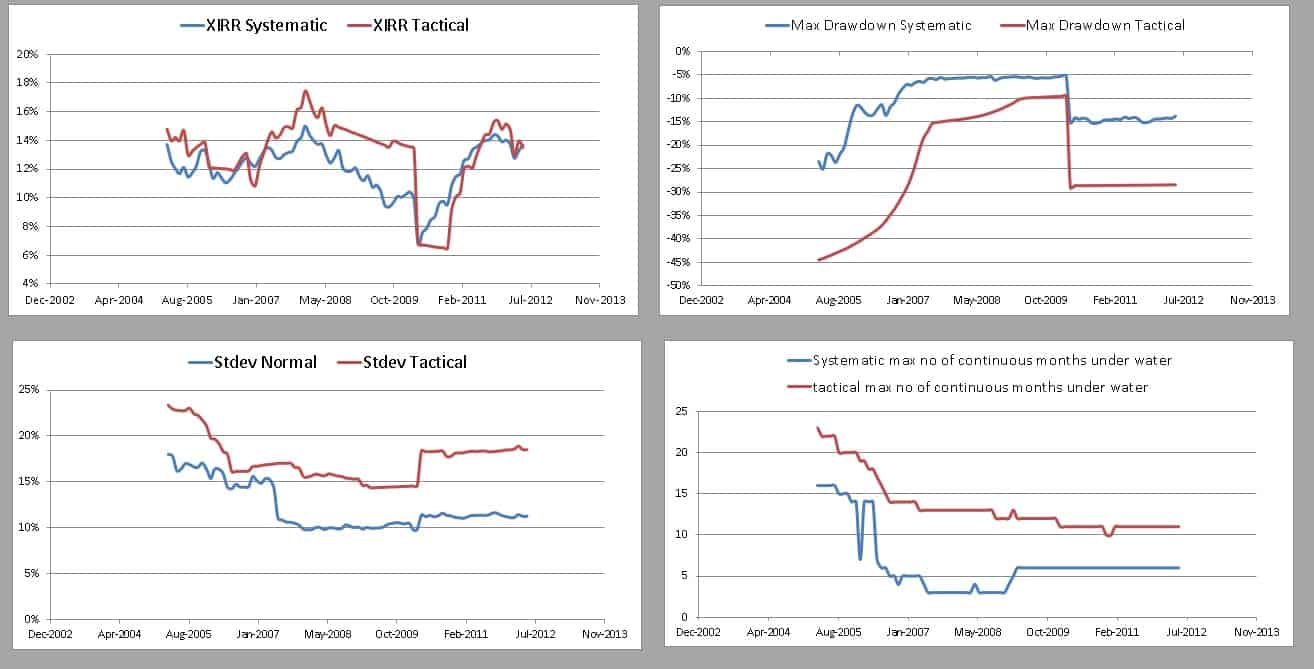
Nifty Smallcap 250 TRI; 10 years; 50% equity
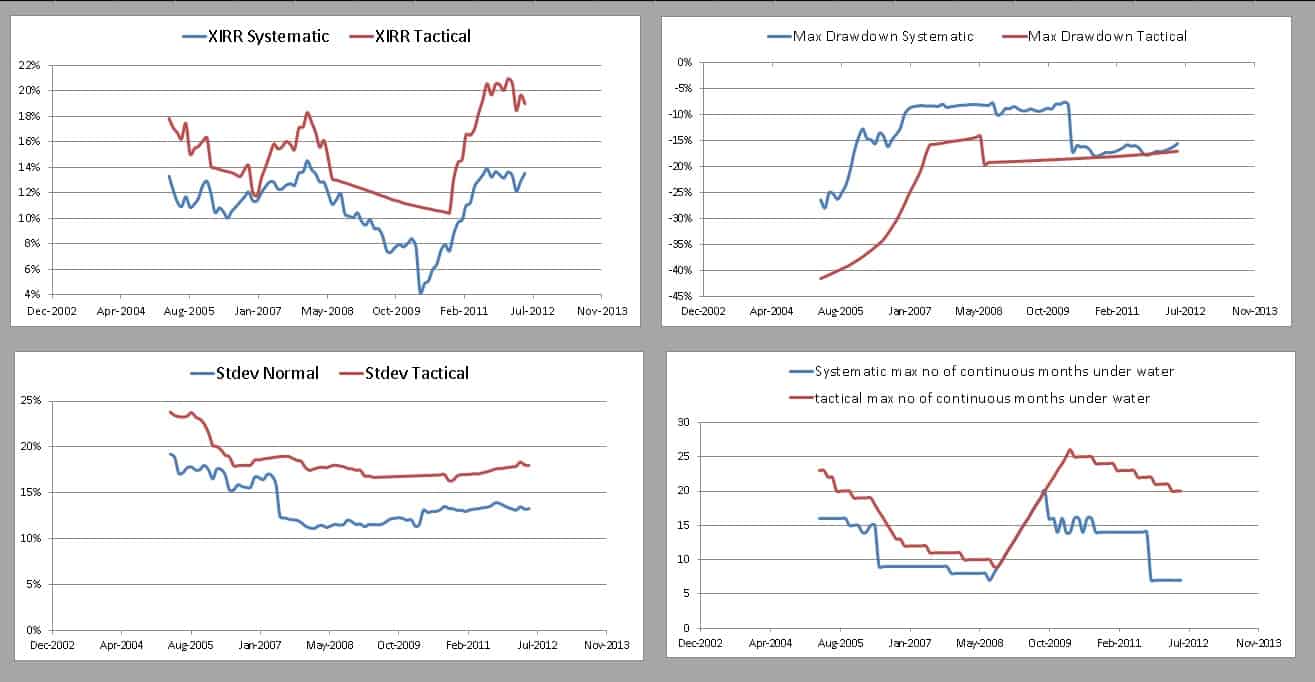
Nifty Smallcap 250 TRI; 5 years; 50% equity