
Last Updated on December 11, 2022 at 7:07 pm
We are delighted to announce a new spreadsheet that can be used to evaluate the annualised return (XIRR) of individual stocks and that of a stock portfolio after properly taking into account corporate actions like dividends, stock splits, bonuses, buybacks and rights issues.
We had recently published an example using this sheet: Stock XIRR Example: 18% annualized return from Colgate-Palmolive. The sheet can be used to compute the XIRR of any number of individual stocks and the overall XIRR of a 30-stock portfolio.
The XIRR makes a distinction between investor action and corporate actions. All corporate actions are deemed to be reinvested in the portfolio at the ex-date. Only investor actions refect in the XIRR calculations. For example, if you purchased 30 stocks over a period of time, all dividends during this time will be treated as reinvested at ex-date. If this results in additional shares of say, 0.6 stocks, the total number of stocks used in the XIRR calculation would be 30.6.
In addition to XIRR, the sheet also computes absolute capital gain, absolute dividend gain, total gain and the CAGR based on the investment weighted average age of the investment or portfolio.
🔥Secure your future with our Robo-advisory tool trusted by over 3,500 investors and advisors. From effortless retirement planning to funding your children’s biggest dreams, turn your financial goals into reality. 🔥
Subscribe for money management solutions via email! (Link takes you to our email sign-up form) Join 32,000+ readers in our community.
👉 New Tool Alert! NaviPlan: A Privacy-Focused Multi-asset Tracker and Goal Planner 👈
The CAGR is computed from the total absolute gain. This is the method adopted by simplywall.st as shown in my monthly stock portfolio updates: My Stock Portfolio May 2021 Update
The average duration of the portfolio is computed as follows.
Suppose you buy Rs. 5000 worth of stocks on 1st Jan 2018 (3.45 years ago) and Rs. 10,000 worth of stocks on 1st June 2019 (2.03 years ago), then the average age duration is: [(5000 x 3.45) + (10000×2.03)]/(1000+5000)
The CAGR = ( 1 + Total Return ) ^ ( 1 / Avg age) – 1
The sheet will compute the CAGR only if the average age is > one year (this can easily be modified by the user). The XIRR will always be computed but it should be taken seriously only the 1st investment was made more than one year ago or if the avg age of the portfolio is > one year.
The sheet is available for download as an Excel sheet. The user must upload the file to Google Drive and open it via Google Sheets. The sheet uses the GOOGLE FINANCE function to retrieve stock price and this will work only on Google sheets. The sheet is completely open-source and can be modified at will. I have extensively tested the file with 391 of my own stock portfolio transactions.
Let us take a look at some screenshots. The file has three sheets with it: “Stock Portfolio XIRR” for the full portfolio; “Single stock XIRR” for single stocks. You can duplicate this sheet any number of times. “AsianPaints” as an example of single stock XIRR calculation. All sheets will have entires. Please delete them before using the sheet.
This is an overview of the stock portfolio sheet.
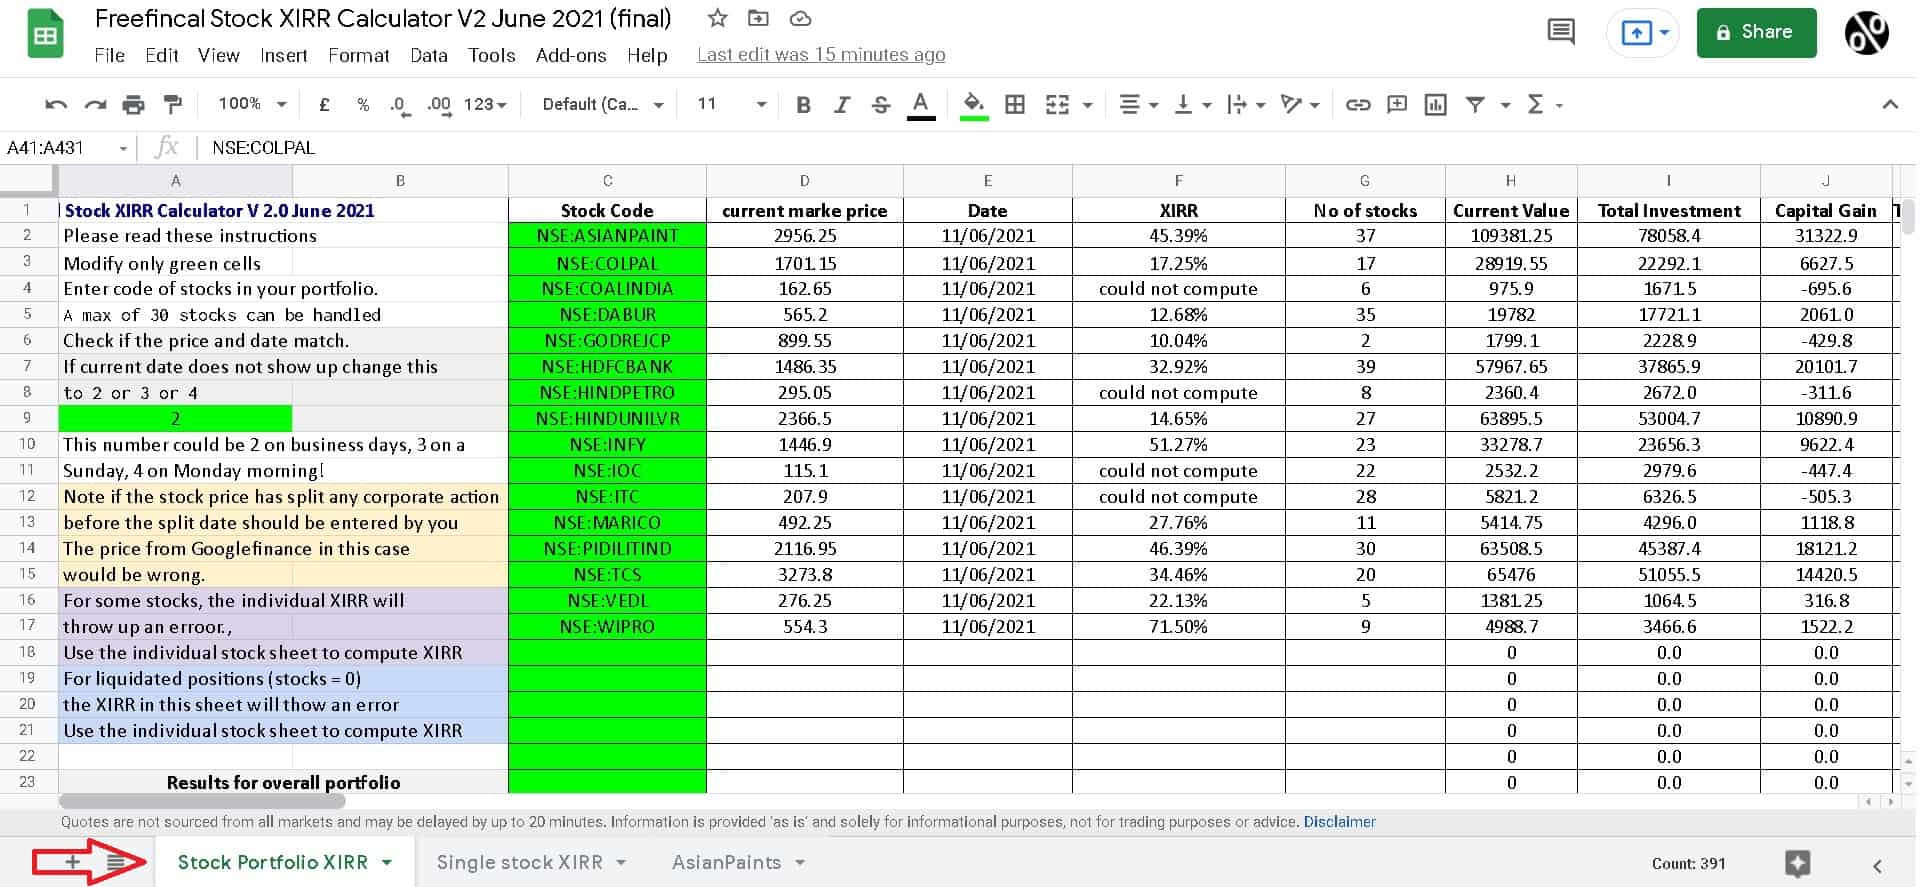
Details of capital gain, XIRR and CAGR of individual stocks. In the overall portfolio calculation, the individual XIRR of some stocks cannot be computed. However, you can create a separate sheet for these stocks to compute XIRR (example in the video below).
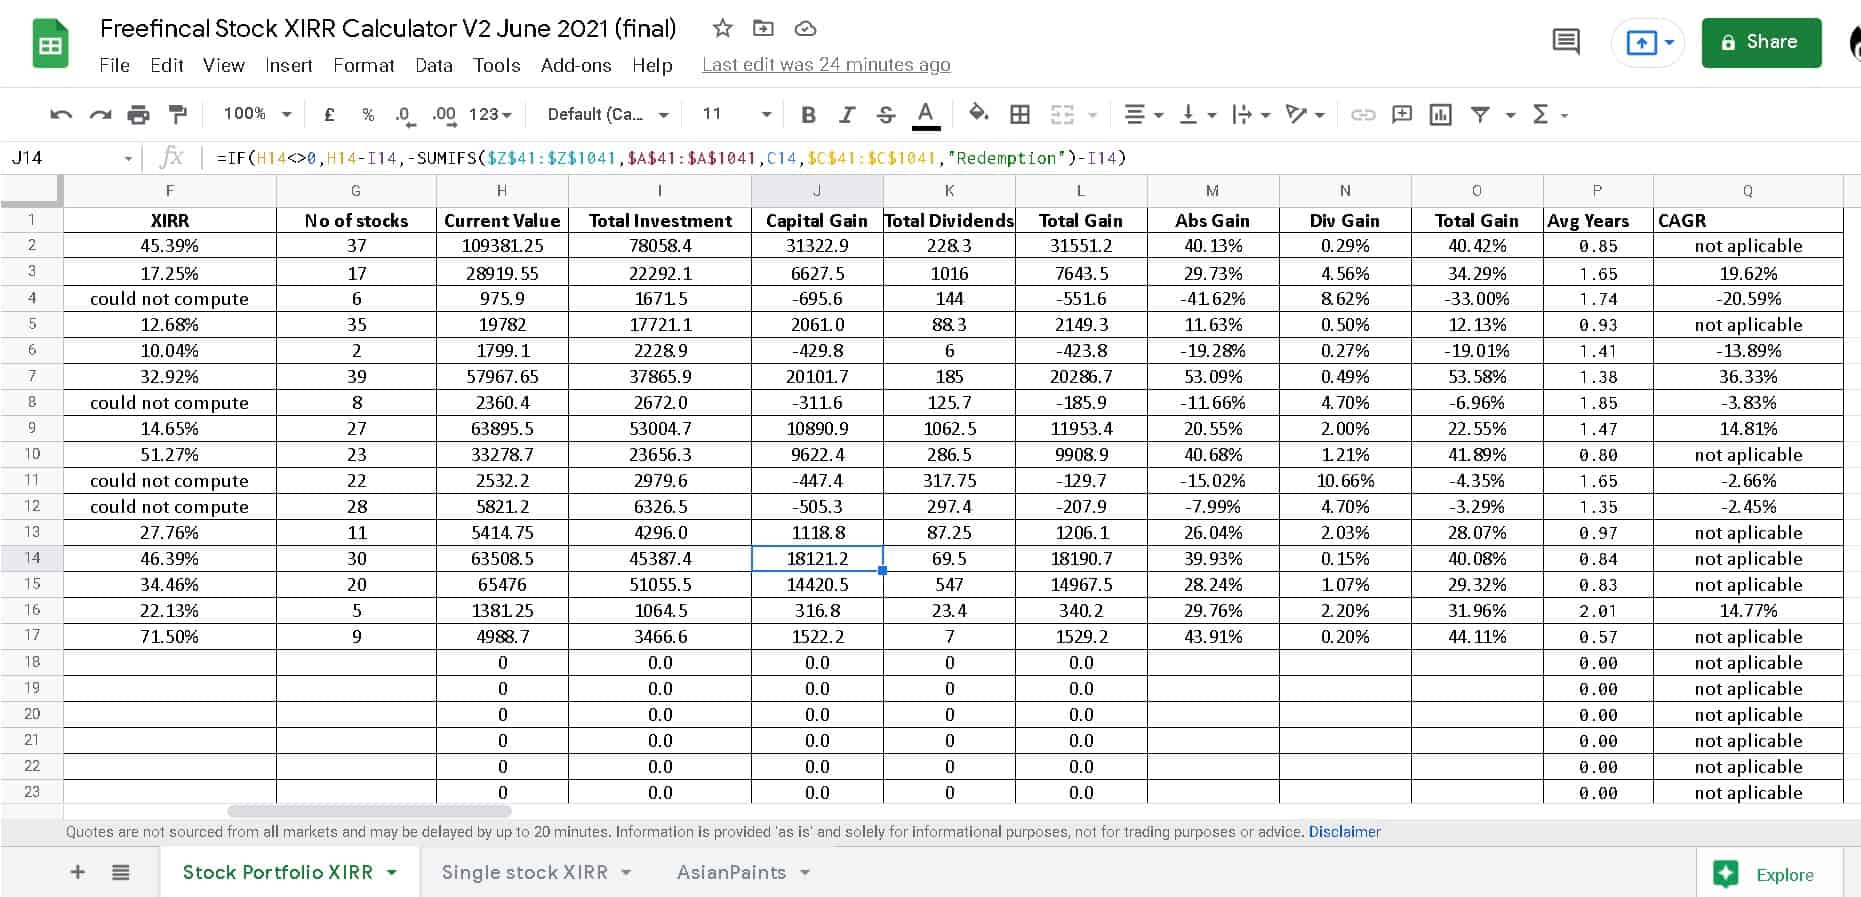
Capital gains, CAGR and XIRR of the overall portfolio is shown below.

This is the transaction entry sheet. The market price for purchase and redemptions should be entered by the user (else closing price for that date will be fetched from Google Finance). For corporate actions, the ex-date should be entered. The price will be fetched from Google Finance.
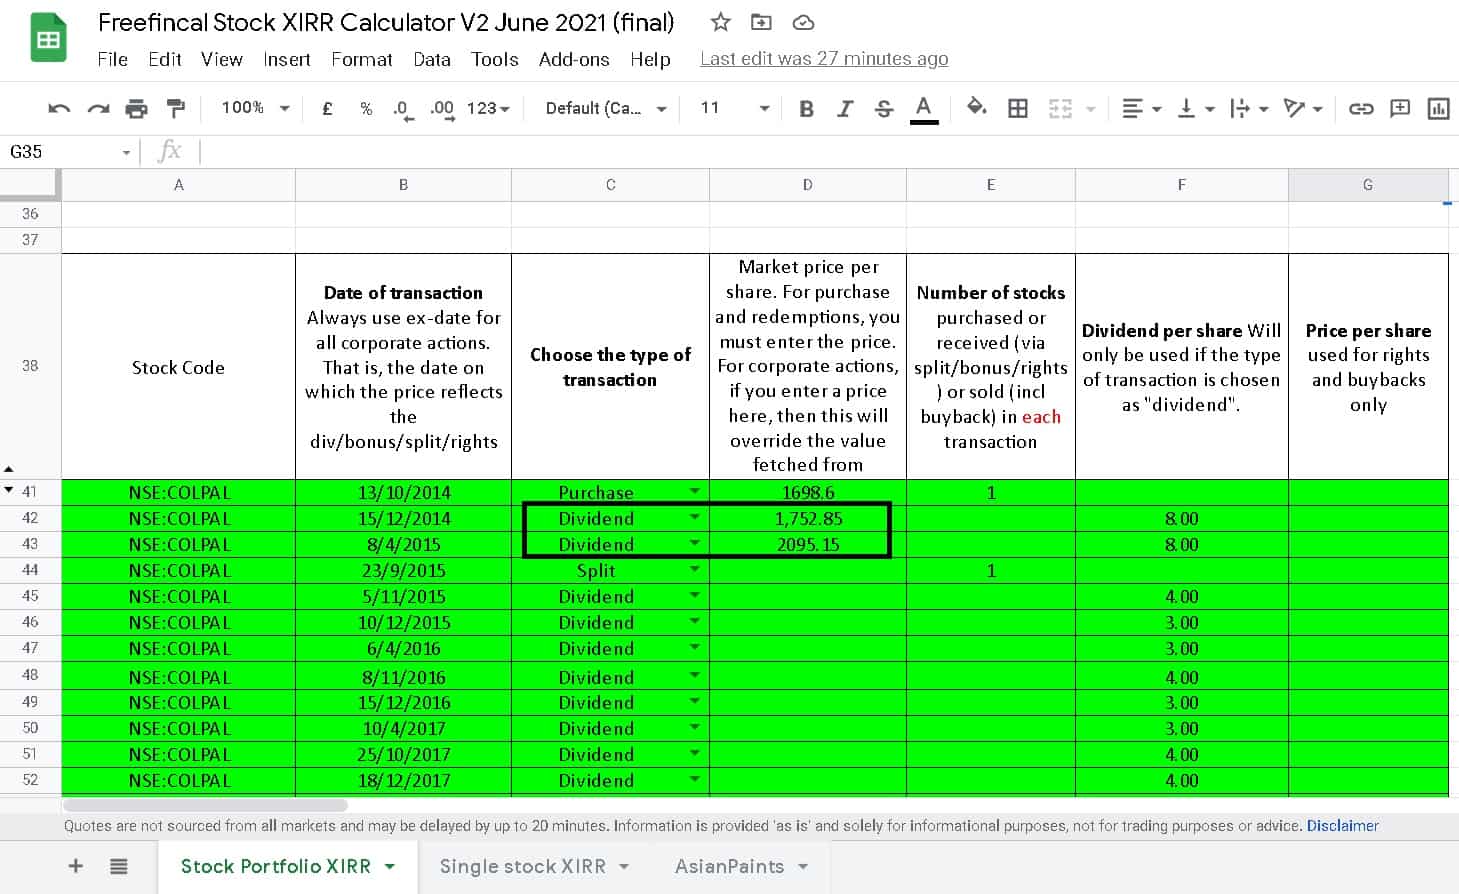
However, as indicated in the black rectangle above, for corporate actions (in this case dividends) before a split, we need to provide the market price as Google finance would incorporate the split to past data as well.
This is an example of a single stock XIRR calculation.

Video walkthrough of the calculator
Get the freefincal stock tracker and XIRR calculator
- The sheet costs Rs. 500 only.
- The sheet will also work for all international stocks. If you are outside India, you can pay via PayPal (9 USD)
- you will have to upload the file to Google Drive and open it in Google Sheets.
- The sheet has been extensively tested for bugs, but we cannot guarantee that it is error-free. In case of bugs, please email freefincal AT Gmail DOT com.
- No refunds, please!
Click here to pay Rs. 500 and instantly download the freefincal stock tracker and XIRR calculator
Outside India? Pay 9 USD via Paypal