Last Updated on December 18, 2021 at 10:49 pm
This simple Monte Carlo simulator gives you the probability of a debt fund, with variable annual returns, outperforming a fixed deposit.
If you are thinking about investing in a debt mutual fund, but are worried about fluctuating returns (volatility) – especially after the recent crash in bonds, this tool could answer a pertinent question:

What is the chance that a debt mutual fund, with fluctuating returns, will give me higher post-tax returns than a fixed deposit?
How does it work? You will need to specify, besides other usual inputs, a conservative average return from the debt fund. In order to do this meaningfully, you will need to first identify a debt fund with an impressive track record suitable to your purpose. By average return I am referring to the final compounded annual growth rate (CAGR) you expect from your investment. It is best to choose a return that is a bit lower than historical values. You could even specify a lower return than the fixed deposit return you have in mind.
🔥Secure your future with our Robo-advisory tool trusted by over 3,500 investors and advisors. From effortless retirement planning to funding your children’s biggest dreams, turn your financial goals into reality. 🔥
Subscribe for money management solutions via email! (Link takes you to our email sign-up form) Join 32,000+ readers in our community.
👉 New Tool Alert! NaviPlan: A Privacy-Focused Multi-asset Tracker and Goal Planner 👈
You will also need to specify the standard deviation of the returns. This is a measure how much the annual returns deviate from the average (see note below regarding this average). A risky fund will have higher standard deviation. Once you choose your debt fund or at least the type of debt fund, you can get an idea of what kind of a standard deviation to enter in the simulator. You can get this data from Morning Stars fund sheet. The data for SBI dynamic bond is shown below (the title and volatility Measures sections have been joined. Red highlighting added).
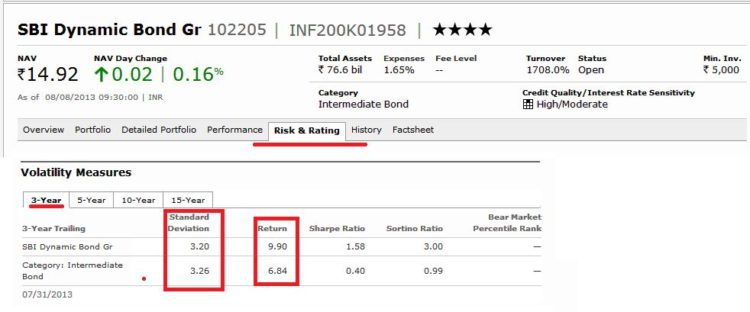
Be sure to study how returns and standard deviation (std. dev. is wrt a return) vary with investment duration. Here is a good introduction to the standard deviation. Choose the highest standard deviation and lowest returns for a reasonable estimate.
You will also need to enter the number of times the debt fund annual returns will be randomly varied (max. 500). For each such trial, the post-tax debt fund and FD return will be compared. The number of times the debt fund has outperformed the FD is given as a probability.
This kind of simulation is known as Monte Carlo simulation since it is like tossing a dice and setting the result of the toss as the return (Monte Carlo is famous for Gambling). For those interested here is my Monte Carlo Retirement Simulator
There are two kinds of FD post-tax returns: one in which total tax on FD income is paid each financial year and another in which tax (except TDS) is deferred until maturity. More about this can be found here: Debt Mutual Fund vs. Fixed Deposit Comparator – Version II
To get an idea about how the kind of random returns generated, there is another button which executes only one trial.
Note:
- There are two kinds of averages (or mean). Arithmetic average and geometric average. To know how these are calculated and how they can be used as a measure of stock market volatility, see: Understanding the Nature of Stock Market Returns
- Each type of average has its own standard deviation. Usually, in the context of returns, the geometric average (CAGR) is used for returns. Technically this means the geometric standard deviation should be used along with it. However,the GSD is a number and not a percentage(in this case). Therefore,the arithmetic standard deviation associated with the arithmetic mean is more commonly used as it is a percentage.
- In the simulator, although the debt fund returns input cells refers to CAGR, the random return generation formula assumes this to be an arithmetic average. For instruments with small volatility (relative to equity that is!), this should not matter too much.
- If you un-hide the cells in the simulator, you can see I have toyed around with the GSD. More can be done with this. If you are interested for a specific application, let me know.
- I have assumed that the returns fall in a normal distribution. This may not be accurate. However,for the purposes of volatility illustration and for making a conservative probability estimate, this should definitely suffice.
- If you don’t like this, then the only option is to compare with actual historical annual returns. This is possible on a fund by fund basis (coming soon!). However it is difficult to compare a fixed deposit with all debt funds of one particular category.
- Moneylife has made such a ‘study’ for their recent article (a subscription of at least Rs. 100 is needed for access). They have considered ‘average returns of debt schemes that have a corpus above Rs100 crore’. Not too impressed with this. The ‘study’ does not mention the kind of debt funds that have been considered.
- According to Value Research Online, there are 149 liquid funds, 4 short term gilt funds, 48 long and medium term gilt funds, 144 ‘income’, dynamic bond and similar funds with a corpus of above Rs. 100 crore. To average returns from such diverse funds does not appear intelligent to me.
- This is again a classic example of data mining and sensationalist reporting. It is time to ask (again), Is This Financial Literacy?
- If you are a fan of Moneylife magazine, feel free to criticise me. I promise to publish all criticisms. Do share this article among other fans!
- Try the simulator with different tax slabs for some insightful results.
Download the debt mutual fund vs. fixed deposit simulator
Please use the tool and let me know
- If it helps you get an idea of debt fund return volatility and make an investment decision
- If you can think of ways in which this can be made better.
- Please share your results and insights in the comments section. This will help everyone.
Related articles
- Debt Mutual Fund vs. Fixed Deposit Comparator – Version II
- Investors Cannot Eat Their Cake And Have It Too!
- Comprehensive Fixed Deposit Calculator – I: Total and Advance Tax Liability
- Comprehensive Fixed Deposit Calculator – II: The Income Clubbing Headache
- Is This Financial Literacy?
- Step-by-Step Guide to Selecting a Mutual Fund
- Mutual Fund Returns Comparison: Direct Plan vs. Regular Plan
- The Permanent Portfolio: A Fascinating Low-Volatility Option For The Long Term Indian Investor?