Last Updated on December 28, 2021 at 6:31 pm
Although many equity investors like to think that they are saner than crypto-investors, the truth is that there is not much difference in their investment “strategies” (if we can call it that). I am referring to “Hodl to the moon” which for equity investors roughly translates as “don’t sell in fear, equity will be profitable over the long term”. This is not a post about cryptocurrencies, in the sense that I will not be referring to them directly. This is a post about “holding risk” and about how time plays a crucial role in determining how profitable we are.
This post is the second part to Should I expect lower returns from equity in future? and is based on a trivia mentioned in Sensex Charts 35 year returns analysis: stock market returns vs risk distribution:
A man buys one unit of Sensex (let us assume index investing was possible then) just days before the Harshad Mehta scam broke on 30th March 1992 with the index at 4091.43 (arrows below). Over the next 25 years, he kept his unshakable faith in Equity and held on to his investment, no matter what. Finally, on 24th March 2017 with the index at 29421.40 (619% increase), he checks the annualized return he has got. What would be the result of this calculation? This is before dividends. A 1.5% to 2% can be added to the return due to dividends.
I wrote this last month when Equity LTCG was still tax-free! Now with the 10% tax (which despite our best gymnastics is unavoidable – unless you want to stay poor ), the effect of the dividend mentioned above is cancelled at least by half. See: Equity LTCG Taxation: How much tax do I need to pay?
This example is one of 354 instances when a 20Y Sensex return computed between April 1979 and Jan 2018 resulted in 10% or lesser returns. Amusingly all those instances are between Feb 1992 and June 1996. Now, if I were a mutual fund sales guy, I would happily claim that is a “one-off” and “unlikely to recur”. Unfortunately, as I am only an investor, I must consider possibilities and not probabilities. I would rather focus on “preparing for the worst” than ignore warnings from the past.
🔥Secure your future with our Robo-advisory tool trusted by over 3,500 investors and advisors. From effortless retirement planning to funding your children’s biggest dreams, turn your financial goals into reality. 🔥
Subscribe for money management solutions via email! (Link takes you to our email sign-up form) Join 32,000+ readers in our community.
👉 New Tool Alert! NaviPlan: A Privacy-Focused Multi-asset Tracker and Goal Planner 👈
Yes, this is a clear case of cherry-picking. However, I am not picking good cherries. I am worried about the rotten ones. You get life insurance and health insurance because you want to protect against the possibility of life offering your family rotten cherries. The logic is identical here.
Equity investing (or crypto trading) requires continuous risk management and a proper exit strategy. The first step is to recognise, that things will not magically turn out okay in the end.
Before we consider, let us consider the situation mentioned in the title. The Sensex closed on 4084 on Feb 22, 1994, and was 20464 on Feb 17, 2014. Again, if you look at only that information, it seems awesome – a 400% increase ( 5 times). However, the annualized return is only 8% (excluding dividends, but even if you include them, the central message will not change).
Yes, money was made: 4000 to 20,000 is hardly small. However, during the first 7 years of the investment journey, most fixed income rates were pretty high (Because India was recovering from the verge of bankruptcy) – 11-12%(!). Then for almost the entire remaining journey, the fixed income rates were 8%-ish.
Now consider the emotional state of the equity investor in the above time period: The markets had just crashed due to the Harshad Mehta scam, for the entires 90s, the market went nowhere. Then came the 2000- crash, the big bull-run, the 2008-crash, recovery, sideways market and then hope…
Then 8% annualized return on the equity investment is no way proportional to the risk taken by the investor. Now, let us please not start thinking – she could have invested in other stocks, he could have done a SIP (assuming it existed then), she could have invested in mutual funds blah blah.
Excuse me, that is just the denial kicking in. If you think, using SIPs, using mutual funds, investing in “good stocks” (as if we will know when we invest) etc. can prevent us from getting low rewards, then all I can say is good luck. Maybe only good things will happen to optimists.
With all that out of the way, let us ask, why is the annualized return so low when the absolute return or gain or profit is so high?!
The answer is time! Well, that has two meanings – a mathematical one and a philosophical one as in “bad time”!
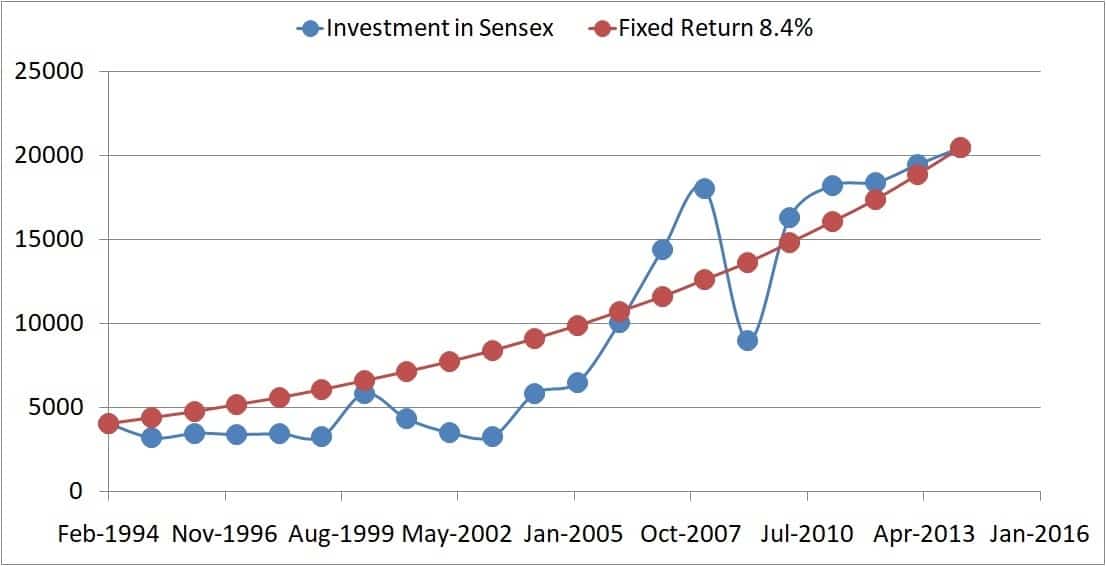
The blue dots represent annual Sensex values. This after 20Y has a cagr of 8.4% (annualized return). If we assume each year gave you 8.4% return, you will get the red dots. So you can see how the idea of annualized return pushes all the ups and downs into the carpet.
You can see the effect of “bad time” here. For the first 9 years, the returns were flat. Then the market zoomed, and then it crashed and then it recovered, but not too much (as of 2014). So after 20Y of patient holding (if that is not hodling to the moon, I don’t know what is), the return is only 8.4%.
Now let us look at it in terms of actual time “lost”
If Rs. 1 became ~ Rs. 5 in one year, the absolute return = annualized return = 400%.
If Rs. 1 became ~ Rs. 5 in two years, the absolute return is the same but the annualized return is 123.8%.
Now see how the annualized return drops as it takes more and more time to achieve the same growth.
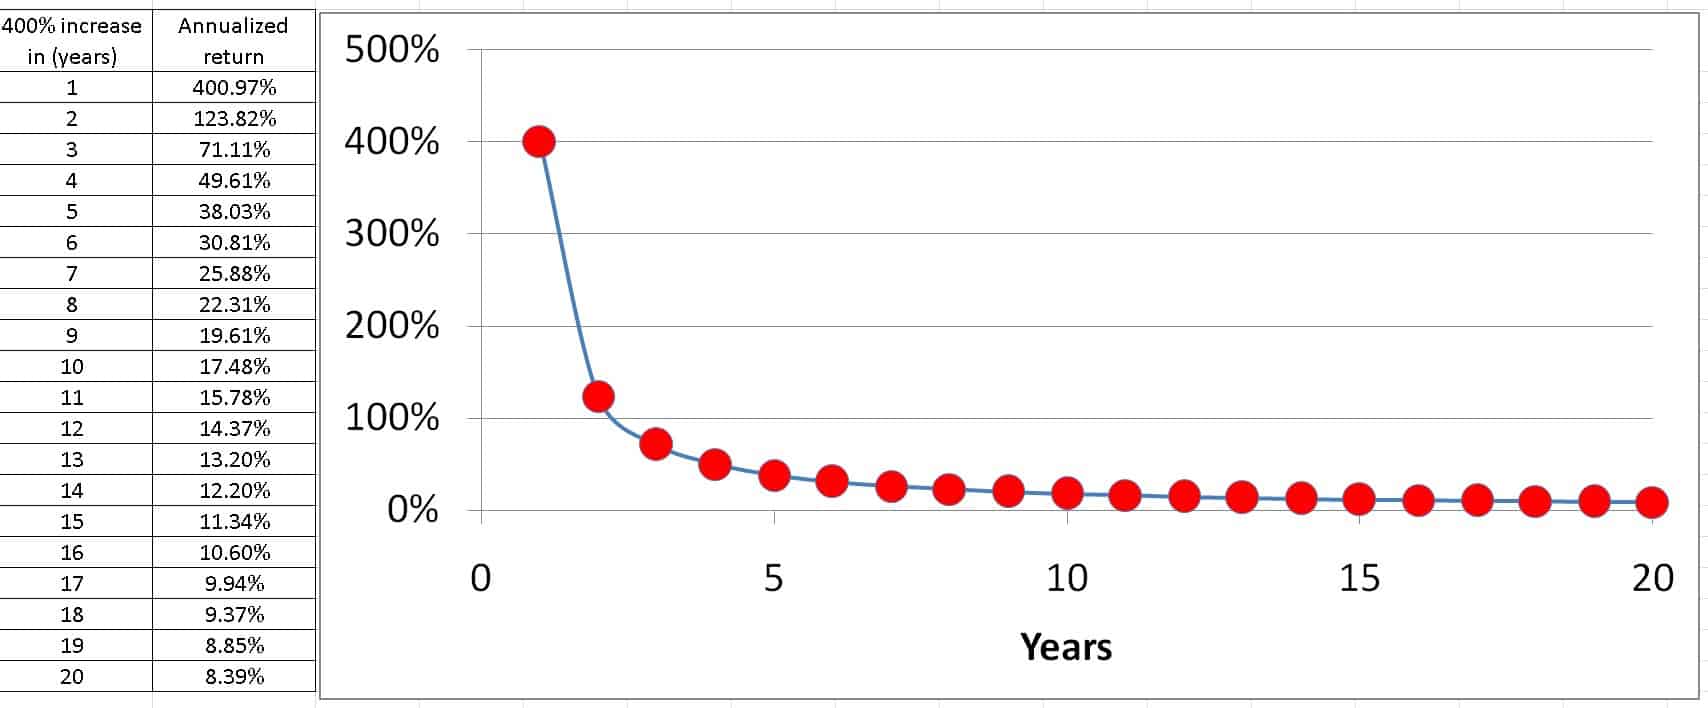
This is hodling to the moon risk, or time risk. For high returns, good growth is essential, but that good growth should also occur reasonably fast!
The same applies to crypto too. Bitcoin may recover and move up. What matters is how soon it does that. The statement “Bitcoin is the future” conveniently ignores the risk of hodling to the moon. Never forget that Bitcoin has seen big periods of flat markets. So its nothing new!
This effect is also known as sequence of returns risk.
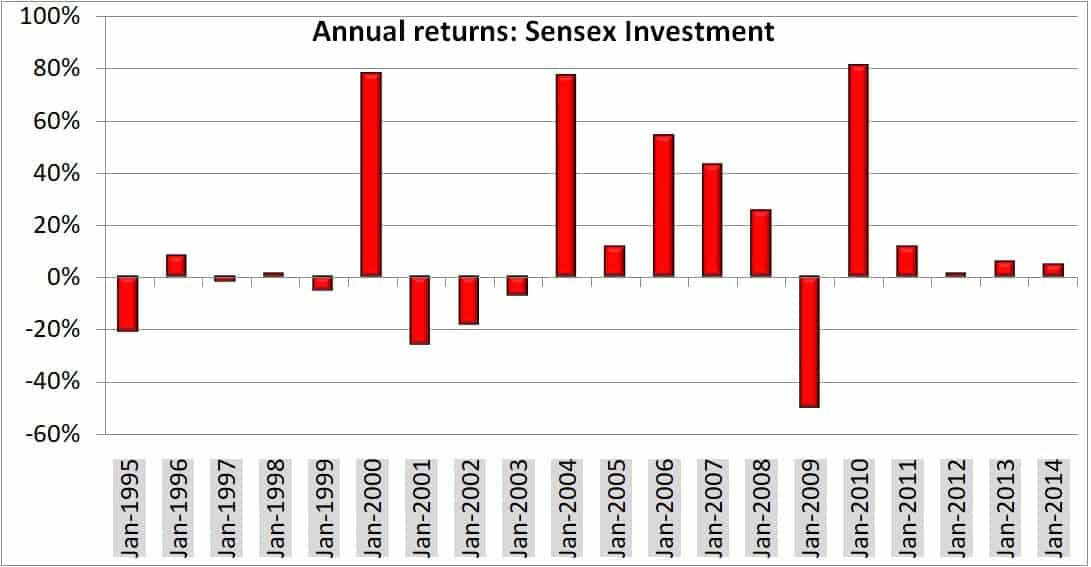
These are the annual returns after each year of investment.
So let us combine the returns:
(1-20.85%) x(1+8.26%) x (1-1.74%) x (1+1.13%) x (1-5.02%) x (1+77.88%) x (1 -25.82%) x (1 -18.38%) x (1 – 7.17%) x (1+ 77.12%) x (1+11.69%) x (1+54.24%) x (1+42.90%) x (1+25.5%) x (1 – 50.13%) x (1+81.11%) x (1+ 11.54%) x (1+ 1.19%) x (1+ 5.82%) x (1 +4.94%)
This gives 5.009. That is Rs. 1 invested and held on for those 20Y would have resulted in Rs. 5.009.
To find the CAGR, we write
1 x (1+ CAGR)^20 =5.009
Which gives CAGR = 8.4%.
^ here means (1+CAGR) is multiplied 20 times (i.e. to the power of 20).
So, what is the point?
When it comes to market-linked instruments, hope that things will work out in the long-term is as bad as over-confidence past on recent high returns.
ABC: Always Be Closing* (out risk):
- Have the right asset allocation at the right time.
- Reset the asset allocation at least once a year initially and then 2/3 times a year later on. So now you need to pay some tax. So what?! Risk reduction is more important.
- Keep an eye on how much money you need for the goal every year and make sure most of it is ready in safe assets. This is why goal based investing is a simple but effective strategy to manage market risk. It gives you purpose.
- If you can pull it off, learn to tactically change asset allocation as per market conditions to reduce risk. This does not mean higher return. Just better sleep. See: Is it possible to time the market?
- Lower expectations mean lesser mistakes, lesser management and again better sleep.
* After the movie Glengarry Glen Ross.
Simple Steps to De-risk Your Investment Portfolio