Last Updated on December 29, 2021 at 5:49 pm
We received this interesting question from a reader who wishes to be anonymous: “There are too many categories of mutual funds. Is there a way by which we can arrange them in terms of their returns?” In this article, we discuss a simple way to do this. We say that equity, debt, gold, real estate are different asset classes. What makes them different?
Is it the returns that they offer? If an equity mutual fund has produced an 18% return over some period of time, we can always find some other point in history where debt (eg gilt funs) or gold has produced the same return for the same period. The same is true for negative returns too. Using returns directly to classify asset classes or different mutual funds will not be consistent. We do use returns for classification but indirectly.
Instead, we can classify mutual fund or asset classes by how much returns fluctuate. Or in effect how much the NAV moves up or down. There are two ways to do this. We shall see how with an example. We shall consider a three-year window for this study, from 26th April 2018 to 26th April 2021 and compute the average of monthly returns of different indices. The indices represent different mutual fund categories.
The standard deviation of monthly returns is a measure of how much the monthly returns deviate from the average monthly return. We have used this measure several times in the past to classify mutual funds. See for example: When to choose what mutual fund? And The key to successful mutual fund investing. In this article, we shall directly use returns to appreciate how much the returns fluctuate and classify them.
🔥Secure your future with our Robo-advisory tool trusted by over 3,500 investors and advisors. From effortless retirement planning to funding your children’s biggest dreams, turn your financial goals into reality. 🔥
Subscribe for money management solutions via email! (Link takes you to our email sign-up form) Join 32,000+ readers in our community.
👉 New Tool Alert! NaviPlan: A Privacy-Focused Multi-asset Tracker and Goal Planner 👈
The average monthly return of the CRISIL Liquid Fund Index over the three year period mentioned above is 0.49%. We can convert this into an annualized return: (1+0.49%)^12 -1 = 6%. The annualized return over this three year period (using only start date NAV and end date NAV) is 5.95%. The difference between the two calculations (6% – 5.95%) is a measure of volatility.
Why? In a fixed deposit, each monthly return would be the same. So both return calculation would give you the same result. So with zero difference to represent no volatility, we get an estimate of the volatility of a liquid fund index: 0.05% (approximately). Any departure from zero represents fluctuating returns.
To compute the standard deviation, we compute the difference between each monthly return and the average monthly return (there are 36 such data points for our duration). Take the square of this difference and compute the average. Then take the square root of that average. This will always be positive. Higher the standard deviation, the higher the volatility in price. This is only one type of risk.
Even this can be misleading. If you look only at the last three years, gold could have smoothly gone up or crashed or moved nowhere, while equity could have done the opposite. So a rolling standard deviation analysis (like return) is necessary for better consistency. The data presented below should be only be considered as a flavour of what to expect only represents the volatility for the period considered. The standard deviation of some indices can swing as wildly as their returns!
Some segments are always more volatile. For example, small cap indices are typically always more volatile than large cap indices and so on. So interpreting this data requires some perspective.
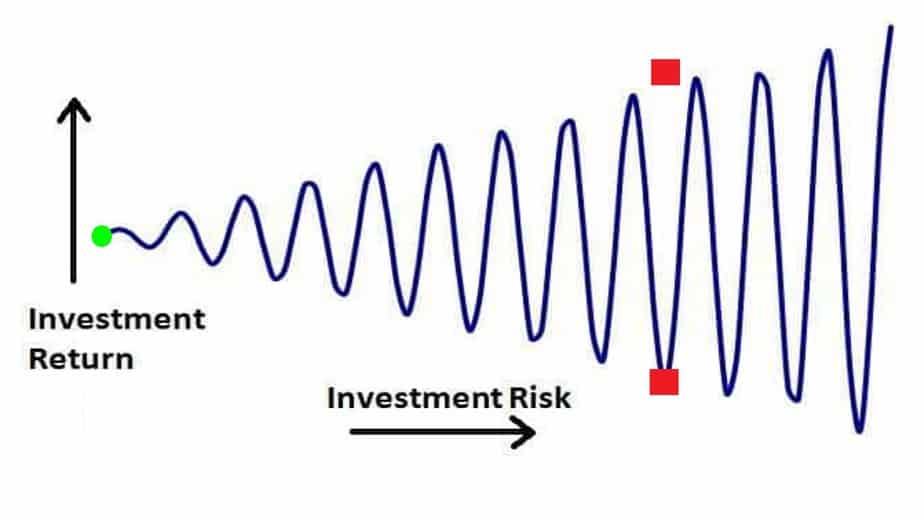
How does using standard deviation help? Higher the value, the higher the volatility in NAV, the higher the fluctuations in returns. Higher fluctuations in returns only mean that and do not mean the possibility of higher returns! Higher the spread in returns, the higher the uncertainty in what return we would get! See: Do not expect returns from mutual fund SIPs! Do this instead!
We present standard deviation and return difference data (bare value) for 161 indices. We recommend readers see how the standard deviation increases as we move from debt funds to gold to international equity, hybrid funds, diversified equity, thematic indices and other commodities.
Several interesting inferences (over the time windows studied) can be made. A few are:
- Gold is three times more volatile than gilt funds
- The aggressive hybrid index is only a bit less volatile than equity indices
- Merval (Argentine index) and Brent Oil are the most volatile (pole apart from the overnight index!)
- Midcap, smallcap and thematic indices occupy the bottom of the table.
Note: The difference between the return from the arithmetic mean and annualized return (geometric mean) should always be positive since AM >= GM. Thanks to Siva in AIFW for pointing this out.
| Benchmark Name | Standard Deviation | Return Difference |
| Nifty 1D Rate Index | 0.12 | |
| Crisil 91 Day T-Bill Index | 0.14 | 0.04 |
| Crisil Liquid Fund Index | 0.14 | 0.06 |
| Nifty 50 Arbitrage Index | 0.24 | 0.06 |
| Crisil 1 Yr T-Bill Index | 0.28 | 0.00 |
| Crisil Short Term Bond Fund Index | 0.69 | |
| Crisil Composite Bond Fund Index | 1.11 | |
| I-BEX (I-Sec Sovereign Bond Index) | 1.15 | |
| Crisil 10 Yr Gilt Index | 1.27 | |
| CRISIL Hybrid 85+15 – Conservative Index | 1.51 | 0.06 |
| CRISIL Short Term Debt Hybrid 75+25 Fund Index | 1.94 | 0.50 |
| USD INR | 1.95 | 1.09 |
| CRISIL Short Term Debt Hybrid 60+40 Fund Index | 2.84 | 1.04 |
| Gold-London AM | 3.45 | |
| Gold-International | 3.67 | |
| KLSE Composite | 3.87 | 0.85 |
| Swiss Market | 3.94 | 2.08 |
| Gold-London AM (INR) | 3.95 | 0.90 |
| CRISIL Hybrid 35+65 – Aggressive Index | 4.35 | 2.18 |
| Shanghai Composite | 4.46 | 0.45 |
| Silver | 4.58 | 2.12 |
| MCX GOLD SPOT | 4.62 | 1.58 |
| FTSE 100 | 4.78 | 3.86 |
| Dow Jones | 4.99 | 1.49 |
| S&P 100 | 5.00 | 1.33 |
| Dow Jones Composite Index | 5.02 | 1.65 |
| S&P 500 | 5.07 | 1.41 |
| Dow Jones Utility Average | 5.11 | 2.57 |
| NIFTY 50 Shariah – TRI | 5.21 | 2.76 |
| NIFTY FMCG – TRI | 5.24 | 4.39 |
| NIFTY 100 Low Volatility 30 Index – TRI | 5.24 | 4.29 |
| NIFTY Alpha Quality Value Low-Volatility 30 – TRI | 5.26 | 3.46 |
| Nasdaq Other Finance | 5.26 | 1.28 |
| NIFTY Quality Low-Volatility 30 – TRI | 5.27 | 3.79 |
| S&P BSE FMCG | 5.28 | 4.43 |
| Taiwan Weighted | 5.29 | 2.97 |
| S&P BSE Fast Moving Consumer Goods – TRI | 5.29 | 4.46 |
| NIFTY Alpha Low-Volatility 30 – TRI | 5.40 | 3.97 |
| Hang Seng | 5.41 | 1.19 |
| NIFTY Alpha Quality Low-Volatility 30 – TRI | 5.42 | 4.15 |
| Nifty Low Volatility 50 – TRI | 5.44 | 3.82 |
| S&P BSE 500 Shariah – TRI | 5.50 | 4.18 |
| Nifty 50 Value 20 Index – TRI | 5.50 | 3.71 |
| Nasdaq Telecommunications | 5.54 | 1.84 |
| Nifty 500 Shariah – TRI | 5.63 | 3.43 |
| Nasdaq-100 | 5.66 | 0.79 |
| NIFTY CONSUMPTION – TRI | 5.68 | 3.92 |
| Jakarta Composite | 5.70 | 0.49 |
| Nifty Shariah 25 – TRI | 5.76 | 3.34 |
| Nasdaq | 5.79 | 1.05 |
| SHARIAH25 | 5.79 | 3.37 |
| NIFTY DIV OPPS 50 – TRI | 5.83 | 4.51 |
| NIFTY MNC – TRI | 5.90 | 4.29 |
| Nifty 100 Quality 30 Index – TRI | 5.91 | 4.48 |
| Nasdaq Industrial | 5.96 | 1.23 |
| Nikkei 225 | 5.98 | 4.70 |
| S&P BSE TECk Index – TRI | 6.08 | 5.18 |
| NIFTY SME EMERGE Index – TRI | 6.15 | 5.43 |
| S&P BSE GREENEX – TRI | 6.23 | 4.39 |
| Nasdaq Insurance | 6.24 | 2.52 |
| S&P BSE SENSEX – TRI | 6.31 | 4.29 |
| S&P BSE Sensex 50 – TRI | 6.36 | 4.31 |
| S&P BSE Large Cap – TRI | 6.38 | 4.38 |
| S&P BSE 100 – TRI | 6.42 | 4.38 |
| Nasdaq Biotechnology | 6.43 | 1.29 |
| NIFTY 100 – TRI | 6.43 | 4.42 |
| NIFTY 50 – TRI | 6.44 | 4.37 |
| S&P BSE 100 ESG Index | 6.45 | 4.69 |
| Nasdaq Computer | 6.50 | 1.21 |
| S&P BSE 200 – TRI | 6.51 | 4.61 |
| S&P BSE LargeMidCap – TRI | 6.52 | 4.55 |
| S&P BSE 250 LargeMidCap Index – TRI | 6.52 | 4.61 |
| S&P BSE CARBONEX – TRI | 6.54 | 4.54 |
| Madrid General | 6.56 | 4.29 |
| NIFTY 200 – TRI | 6.59 | 4.67 |
| Seoul Composite | 6.60 | 3.16 |
| S&P BSE SME IPO – TRI | 6.64 | 4.52 |
| S&P BSE 500 – TRI | 6.67 | 4.77 |
| NIFTY 500 – TRI | 6.73 | 4.81 |
| S&P BSE AllCap – TRI | 6.75 | 4.90 |
| S&P BSE 250 LargeMidCap 65:35 Index – TRI | 6.77 | 5.06 |
| S&P BSE Information Technology – TRI | 6.81 | 7.49 |
| S&P BSE IT | 6.81 | 7.43 |
| NIFTY NEXT 50 – TRI | 6.83 | 5.03 |
| NIFTY 50 Equal Weight Index – TRI | 6.91 | 4.65 |
| S&P BSE Telecom – TRI | 6.94 | 0.85 |
| S&P 400 | 6.97 | 3.31 |
| Nifty Growth Sectors 15 – TRI | 6.99 | 5.46 |
| Nifty LargeMidcap 250 Index – TRI | 7.05 | 5.33 |
| NIFTY 100 Equal Weight Index – TRI | 7.08 | 4.91 |
| Nifty Tata Group – TRI | 7.08 | 9.15 |
| NIFTY SERV SECTOR – TRI | 7.11 | 4.96 |
| NIFTY INFRA – TRI | 7.14 | 4.10 |
| NIFTY IT – TRI | 7.16 | 8.16 |
| S&P BSE DOLLEX 30 | 7.17 | 4.04 |
| Dow Jones Trasportation Averag | 7.19 | 3.28 |
| Nasdaq Transportation | 7.21 | 2.03 |
| S&P BSE Sensex Next 50 – TRI | 7.27 | 5.16 |
| S&P BSE Utilities – TRI | 7.27 | 4.45 |
| S&P BSE Consumer Discretionary Goods & Services – TRI | 7.29 | 5.24 |
| NIFTY DEFTY | 7.30 | 4.17 |
| S&P BSE DOLLEX 100 | 7.32 | 4.17 |
| S&P BSE DOLLEX 200 | 7.40 | 4.41 |
| S&P BSE Consumer Durables – TRI | 7.48 | 4.19 |
| S&P BSE Power Index – TRI | 7.71 | 4.90 |
| S&P BSE MidCap Select Index | 7.71 | 5.56 |
| S&P BSE Mid-Cap – TRI | 7.81 | 6.04 |
| S&P BSE 150 MidCap – TRI | 7.84 | 6.77 |
| RTS Index | 7.84 | 1.52 |
| S&P BSE Health Care – TRI | 7.85 | 5.65 |
| Nifty Midcap 150 – TRI | 7.90 | 6.53 |
| Nifty Alpha 50 – TRI | 7.92 | 7.84 |
| Nifty Tata Group 25% Cap – TRI | 7.97 | 7.30 |
| NIFTY CPSE Index – TRI | 8.08 | 4.21 |
| NIFTY COMMODITIES – TRI | 8.15 | 5.56 |
| S&P BSE OIL & GAS Index – TRI | 8.20 | 4.16 |
| Nifty Midcap 100 – TRI | 8.21 | 6.97 |
| NIFTY ENERGY – TRI | 8.25 | 5.74 |
| S&P BSE SmallCap Select Index | 8.25 | 7.31 |
| S&P CPSE | 8.35 | 4.55 |
| S&P BSE 400 MidSmallCap Index – TRI | 8.37 | 7.14 |
| S&P BSE MidSmallCap – TRI | 8.40 | 7.05 |
| Nifty MidSmallcap 400 Index – TRI | 8.42 | 7.01 |
| S&P BSE Bharat 22 Index | 8.51 | 5.40 |
| Nifty Midcap 50 – TRI | 8.60 | 8.11 |
| Nifty Midcap Liquid 15 – TRI | 8.62 | 7.93 |
| LIX 15 MIDCAP | 8.65 | 7.93 |
| S&P BSE AUTO Index – TRI | 8.67 | 6.87 |
| Nifty Financial Services – TRI | 8.70 | 6.04 |
| NIFTY AUTO – TRI | 8.79 | 6.99 |
| S&P BSE Basic Material – TRI | 8.93 | 7.70 |
| S&P BSE Capital Goods – TRI | 8.99 | 6.33 |
| Nifty 100 Liquid 15 – TRI | 9.01 | 6.38 |
| S&P BSE Small-Cap – TRI | 9.02 | 8.06 |
| S&P BSE Finance – TRI | 9.09 | 6.92 |
| NIFTY PHARMA – TRI | 9.09 | 6.85 |
| Nasdaq Bank | 9.15 | 5.99 |
| S&P BSE PSU – TRI | 9.15 | 5.02 |
| S&P BSE Energy – TRI | 9.19 | 6.84 |
| S&P BSE Enhanced Value Index | 9.51 | 5.58 |
| S&P BSE Industrials – TRI | 9.54 | 7.71 |
| S&P BSE BANKEX – TRI | 9.70 | 7.49 |
| Nifty Smallcap 250 – TRI | 9.75 | 8.44 |
| S&P BSE 250 Small Cap – TRI | 9.77 | 8.54 |
| NIFTY BANK – TRI | 9.80 | 7.65 |
| Nifty Aditya Birla Group – TRI | 9.85 | 6.98 |
| Nifty Private Bank – TRI | 9.87 | 8.24 |
| Nifty Mahindra Group – TRI | 9.96 | 11.78 |
| S&P BSE IPO Index – TRI | 10.21 | 11.57 |
| Nifty Smallcap 100 – TRI | 10.38 | 10.10 |
| Nifty Smallcap 50 – TRI | 10.65 | 9.61 |
| S&P BSE Realty Index – TRI | 10.70 | 9.66 |
| NIFTY REALTY – TRI | 11.05 | 10.29 |
| NIFTY MEDIA – TRI | 11.31 | 7.21 |
| NIFTY METAL – TRI | 11.62 | 11.51 |
| S&P BSE METAL Index – TRI | 11.67 | 11.47 |
| Nifty High Beta 50 – TRI | 11.90 | 10.94 |
| NIFTY PSU BANK – TRI | 13.46 | 8.81 |
| MerVal | 16.39 | 15.82 |
| Brent Crude | 16.87 | 19.77 |