Last Updated on October 8, 2023 at 1:47 pm
In this post, I discuss a simple way to find out if a certain fund or a certain fund category is suitable for our need. We shall the use often-mentioned idea of standard deviation as a simple measure of volatility. Although not perfect, it is good enough to differentiate type based on daily market risk (there are other types of risk that cannot be quantified on a daily basis like credit risk).
Go to the Value research fund page of Quantum Liquid fund and click on the “performance” tab. If you scroll down that page, you will see this box:

The mean represents the average of the last 36 month returns of the fund =6.99%.
🔥Secure your future with our Robo-advisory tool trusted by over 3,500 investors and advisors. From effortless retirement planning to funding your children’s biggest dreams, turn your financial goals into reality. 🔥
Subscribe for money management solutions via email! (Link takes you to our email sign-up form) Join 32,000+ readers in our community.
👉 New Tool Alert! NaviPlan: A Privacy-Focused Multi-asset Tracker and Goal Planner 👈
The Std Dev is the standard deviation of the above mean. That is, it is a measure of much each monthly return has deviated from the average.
It is incorrect to show the mean alone. The right representation is
mean +/- std deviation.
So for quantum liquid, it is 6.99 + 0.29.
For the liquid fund category, it is 7.42 +/- 0.34
Since the standard deviation is significantly lower than the average, each month return does not deviate much from the average. Meaning the volatility over the measure 3 year period is quite low. Therefore liquid funds can be safely used for a 3-year investment.
Of course, if your investment duration is 6 months or one year, you will have to repeat this exercise over that period. This data is not available online. So you can simply plot all possible 6 month or 1Y returns (your duration) over the last 3Y or so to get a visual measure of volatility. See this post for an example: Are Debt Mutual Funds an Alternative to Fixed Deposits? and you can use this tool to calculate for yourself: Mutual Fund SIP and Lump Sum Rolling Returns Calculators
Now suppose we plot the category average 3Y monthly return and its standard deviation for all Value Research categories with the understanding that such categorization is arbitrary and dynamic, we would get the following graph.

The red balls represent the 3Y monthly average and the blue line the spread (+/- standard deviation) in returns.
Notice how the spread increase as we move from:
liquid funds —-> Ultra short term funds —> Gilt short term —> and so on.
This is the data:

I have added some arbitrary colours (like a signal) and risk grades over a 3 year period. you will have to look at individual funds before deciding.
Notice the data for Pharma and IT funds!!
As a thumb rule, a 3Y standard deviation in double digits or close to it, implies the fund or the fund category is only suitable for long-term (10+) or at least medium term (7+) durations. You can see this post for more details: What Return Can I Expect From Equity Over the Long term? Part 2
This is a simple way for the interested investor to figure out “when to choose what”.
Your thoughts, please.
_____________
Use this form to ask Questions ONLY (For comments/opinions, use the form at the bottom)
And I will respond to them in the next few days. I welcome tough questions. Please do not ask for investment advice. Before asking, please search the site if the issue has already been discussed. Thank you. PLEASE DO NOT POST COMMENTS WITH THIS FORM it is for questions only.
[contact-form][contact-field label=”Name” type=”name” required=”1″][contact-field label=”Email” type=”email” required=”1″][contact-field label=”Ask your question (Got an opinion or comment, use comment box at the bottom of the page. DO NOT post them here)” type=”textarea” required=”1″][/contact-form]
GameChanger– Forget Startups, Join Corporate & Live The Rich Life You want
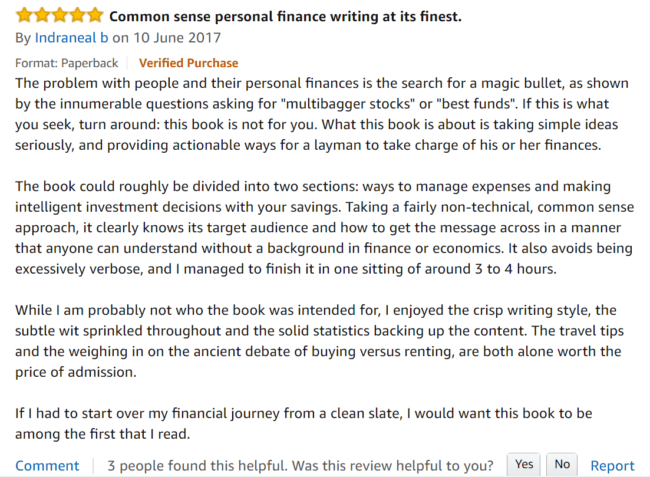
My second book, Gamechanger: Forget Start-ups, Join Corporate and Still Live the Rich Life you want, co-authored with Pranav Surya is now available at Amazon as paperback (₹ 199) and Kindle (free in unlimited or ₹ 99 – you could read with their free app on PC/tablet/mobile, no Kindle necessary).
It is a book that tells you how to travel anywhere on a budget (eg. to Europe at 50% lower costs) and specific investment advice for young earners.

The ultimate guide to travel by Pranav Surya is a deep dive analysis into vacation planning, finding cheap flights, budget accommodation, what to do when travelling, how travelling slowly is better financially and psychologically with links to the web pages and hand-holding at every step. Get the pdf for ₹199 (instant download)
You can Be Rich Too with Goal-Based Investing
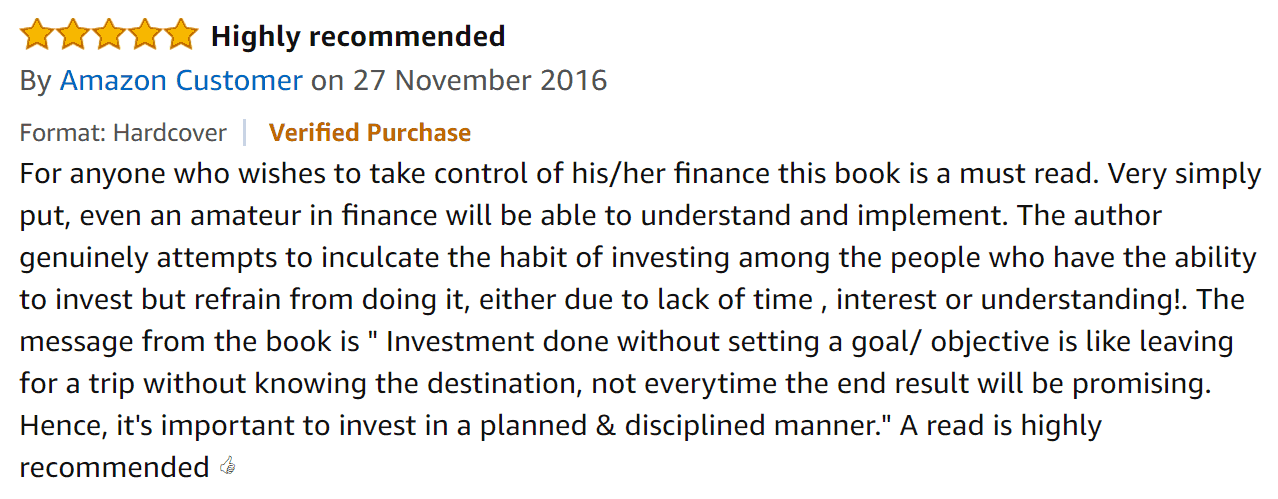
My first book with PV Subramanyam helps you ask the risk questions about money, seek simple solutions and find your own personalised answers with nine online calculator modules.

The book is available at:
Amazon Hardcover Rs. 271. 32% OFF
Infibeam Now just Rs. 270 32% OFF. If you use a mobikwik wallet, and purchase via infibeam, you can get up to 100% cashback!!
Flipkart Rs. 279. 30% off
Kindle at Amazon.in (Rs.271) Read with free app
Google PlayRs. 271 Read on your PC/Tablet/Mobile
Now in Hindi!

Order the Hindi version via this link