Last Updated on July 9, 2026 at 3:46 pm
In this article, Krishna describes a privacy-first personal portfolio tracker with intelligent insights.
Please note: This is a paid tool and Freefincal is not associated with it in any way. This article does not constitute an endorsement. Freefincal and its authors are not responsible for any bugs/errors that the users may encounter. If you are interested in purchasing this tool, please do your due diligence and contact Krishna at srikrishnablr2022 [AT] gmail [DOT]com for more details on how to use it. Now over to the author.
For a while now, I’ve been dissatisfied with how I track my portfolio, as the data is spread across multiple platforms, and online portals pose a privacy risk.
If we look at the current situation, CAMS gives me transaction history. My AMC apps show the current value. A spreadsheet does XIRR. A separate calculator handles tax. And every time I want to answer a question like “Am I actually on track for retirement?” or “Which of my funds is dead weight?” — I’m pulling data from five places, doing mental arithmetic, and still not quite sure.
🔥Secure your future with our Robo-advisory tool trusted by over 3,500 investors and advisors. From effortless retirement planning to funding your children’s biggest dreams, turn your financial goals into reality. 🔥
Subscribe for money management solutions via email! (Link takes you to our email sign-up form) Join 32,000+ readers in our community.
👉 New Tool Alert! NaviPlan: A Privacy-Focused Multi-asset Tracker and Goal Planner 👈
So I built something. A self-hosted automated personal investment dashboard that brings everything into one place, like portfolio tracking, goal planning, tax calculations, retirement projections, and an AI assistant that actually knows your portfolio when you ask it questions.
Privacy: It Runs on Your Machine
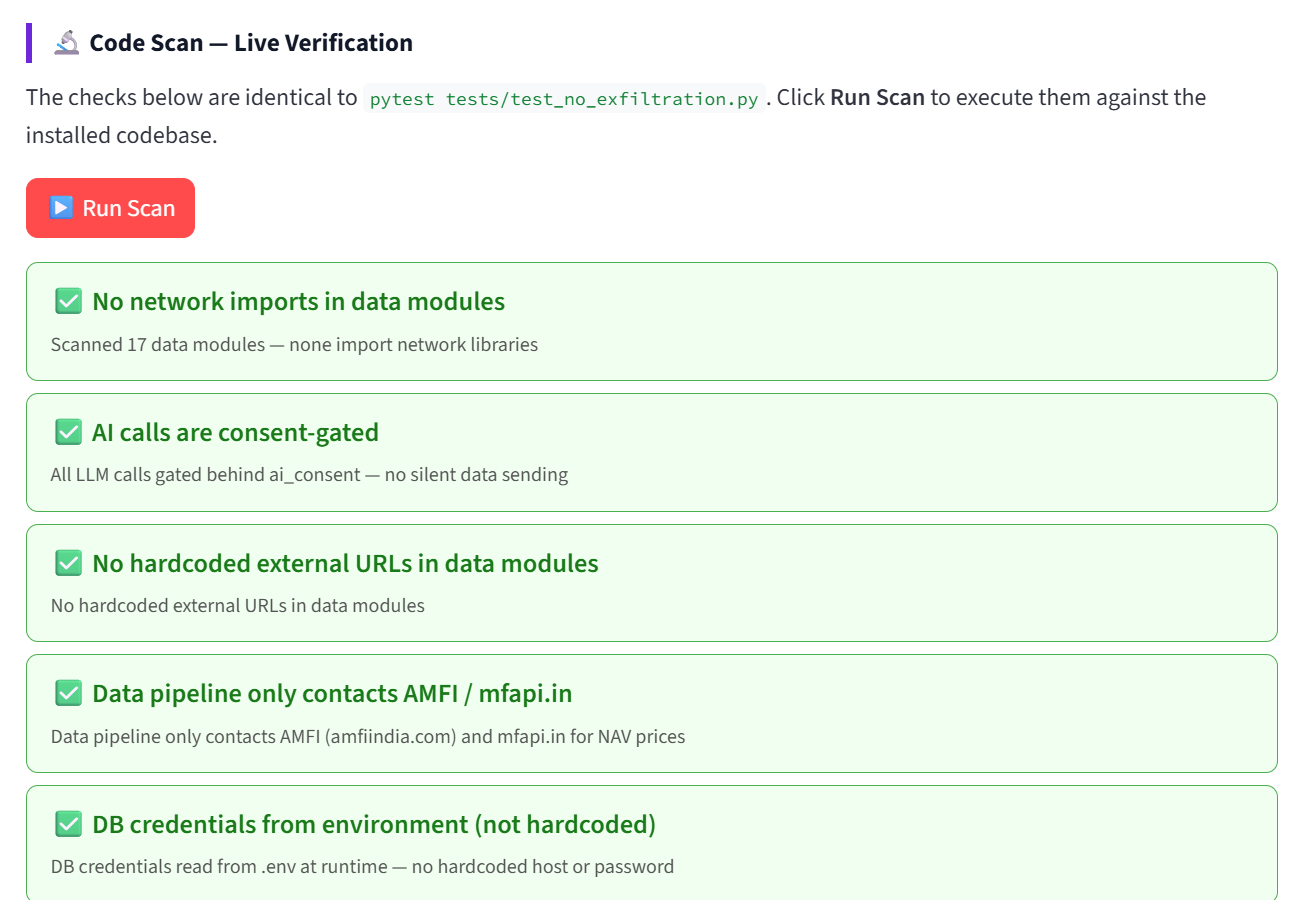
This is a self-hosted tool. Your transaction data from CAMS, NAV history, goals, and decision log all live in a database on your own machine. Nothing is sent to any cloud service except API calls to the AI provider when you explicitly ask a question.
If you’re uncomfortable with even that, the non-AI features work without any API key configured.
Your Portfolio Data Is More Sensitive Than Your Password: Treat It That Way
There is a category of information that financial institutions, advertisers, and bad actors all want access to: a complete picture of your wealth.
Not your password. Not your email. Your actual wealth like what you own, how much it’s worth, where it’s held, what your goals are, and how much you’re investing every month.
Most people protect their bank login carefully and then hand exactly this information to a portfolio tracking app without a second thought.
What “Online” Portfolio Trackers Actually Collect
When you link your portfolio to an online tracker, whether through CAMS SmartStatement, a broker-provided app, or a third-party aggregator, then you are creating a consolidated financial profile that did not exist before.
The data these platforms collect is not just your current holdings. It is:
- Transaction history going back years — every SIP, every switch, every lump sum, with dates and amounts
- Goal and timeline data — when you need money and for what purpose (retirement, child’s education, home purchase)
- Behavioural patterns — how you respond to market crashes, whether you invest regularly, what products you buy and when
- Income signals — the size and frequency of your SIP contributions is a reliable proxy for income, often more accurate than anything you’d voluntarily disclose
This is not theoretical. This is what the data contains. And once you upload it to a server you don’t control, you have no visibility into what happens to it.
In financial services, the monetisation path is direct: a platform that knows your complete portfolio, your goal timeline, and your risk behaviour is in a strong position to sell you products. Insurance recommendations. NFO launches. PMS referrals. “Personalised” advice that is, in practice, the highest-commission product that fits your profile.
This is not a conspiracy theory. It is the standard fintech playbook. The data is valuable specifically because it enables targeted product sales. SEBI has noted this dynamic repeatedly in its circulars on investment advisors and platforms.
Even platforms with good intentions are not immune. A company that collected your data when it was a lean startup may later be acquired by a distribution house, an AMC, or an insurance conglomerate. Your data does not come with a clause that says “new owner cannot access this.”
The Data Breach Risk Is Not Hypothetical
India has had multiple high-profile financial data breaches in the last five years — from insurance aggregators, from brokers, from payment processors. The common thread: centralised databases of financial records are high-value targets precisely because they are comprehensive.
A breach of a portfolio tracker is not like a breach of a food delivery app. The attacker does not get your lunch order history. They get:
- Your complete investment history with exact rupee amounts
- The AMCs you use, the schemes you hold, the dates you invested
- In many cases, linked PAN numbers and email addresses
- Information about when large sums are expected to be available (redemptions near a goal date)
The last point is underappreciated. A data set showing that a particular PAN holder has ₹45 lakhs in a liquid fund with a redemption goal of “6 months” is a high-value social engineering target. Fraudsters do use this kind of data.
The Aggregator Consent Problem
Several platforms offer “one-tap portfolio aggregation” by requesting access to your CAMS and KFintech accounts. This is convenient. It is also a standing authorisation you may not remember granting.
Read the consent terms carefully — most grant the platform the right to access your consolidated statement repeatedly, not just once. Some grant it indefinitely until you revoke it. The revocation path is rarely as simple as the consent path.
Account aggregation under the AA (Account Aggregator) framework adds a regulatory layer, which is progress. But even a regulated aggregator centralises access to data that was previously fragmented by design.
Why Self-Hosting Changes the Risk Profile
This tool runs entirely on your machine. The data is:
- Stored in a database on your own computer or local server — not in a cloud
- Never transmitted to any external service except the two calls you explicitly initiate: NAV data from AMFI (which sends no identifying information — it’s just a fund code lookup) and optional AI queries to the Claude API (which you can disable entirely)
- Not linked to your PAN, Aadhaar, or email — the tool has no account system, no registration, no identity layer
The AI feature is worth addressing directly. When you ask Portfolio Chat a question, the text of your question and your portfolio summary are sent to the API. No transaction history, no PAN, no linked identity. You can review exactly what is sent and it’s visible in the code. And if you’d prefer to use the tool entirely offline, every non-AI feature works without an API key configured.
The threat model changes completely. There is no central database to breach. There is no company with access to your records. There is no acquisition event that changes the terms of your data relationship. There is no recommendation engine whose interests are misaligned with yours.
The Honest Tradeoff
Self-hosting requires more setup than clicking “Sign up with Google.” You need to run a database, keep a local application running when you want to use it, and manage your own backups. That is a real cost.
The question is whether that cost is worth paying in exchange for full control of a complete picture of your financial life.
For most people using a free tracker, the implicit answer has been: the convenience is worth it, and the risk is low.
The risk is not as low as most people assume. And the convenience of the alternatives is high enough to make it easy not to think about it.
This tool is for people who have thought about it and decided differently.
Here’s what it does.
Your Portfolio, Organised Around Goals — Not Fund Names
Most dashboards show you a list of funds with current values. That’s useful, but it doesn’t answer the question you actually care about: how close am I to what I’m trying to achieve?
This tool is organised around financial goals. You create a goal — Retirement, Child’s Education, Home Down Payment etc and map your funds to it. The dashboard then tracks each goal independently: how much is invested, what the current corpus is, what the XIRR has been, and whether you’re on track.
Creating a goal takes thirty seconds. Describe it in plain English, and the system fills in the details like target amount, timeline, and required monthly investment. No forms.
Debt & Fixed Income: EPF, NPS, PPF, and Superannuation Finally in the Same Place
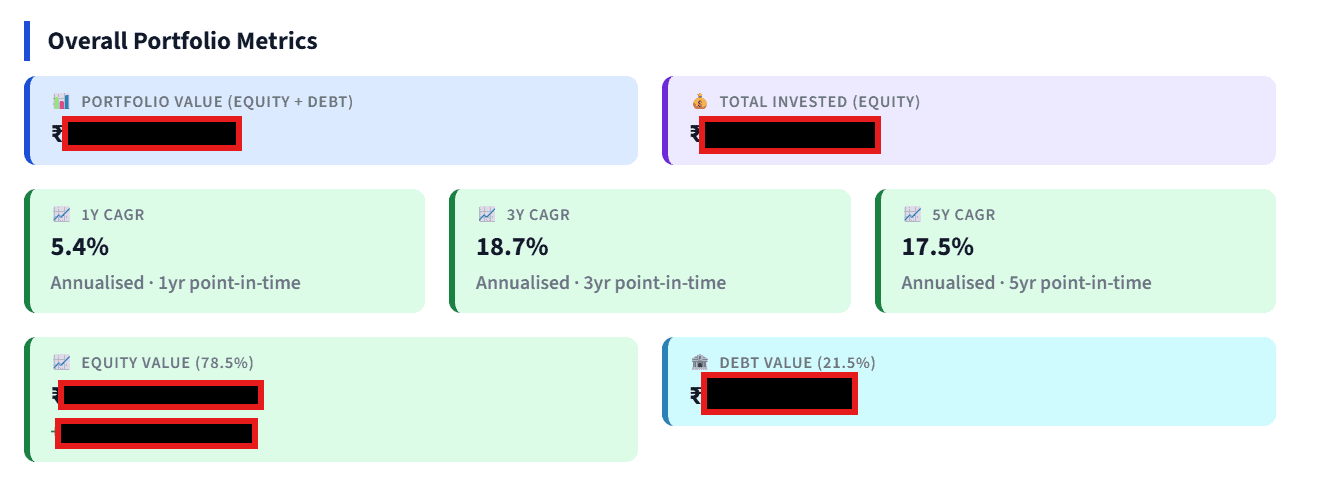
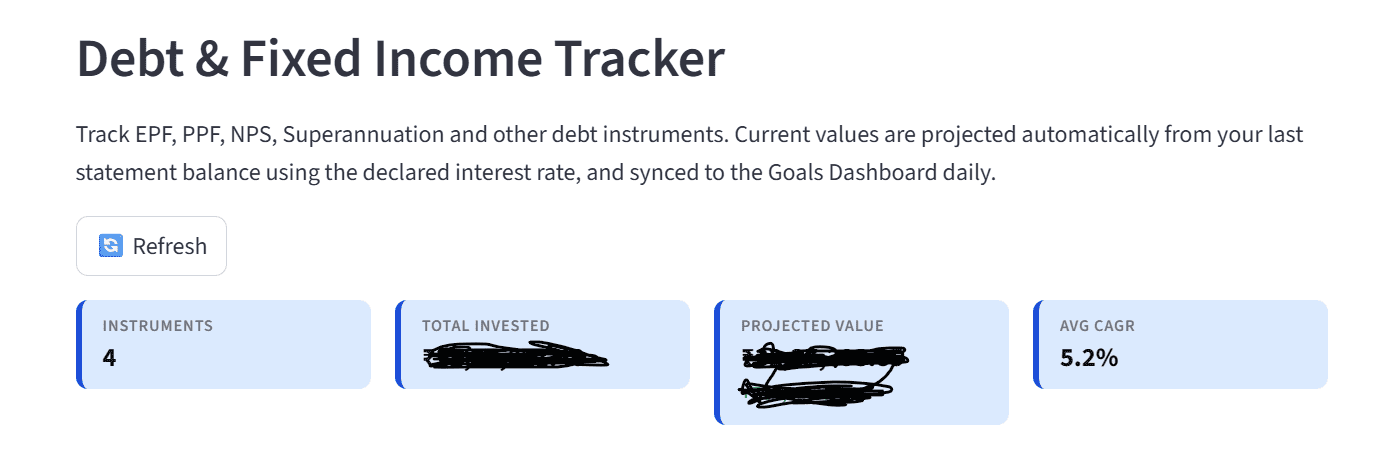
Most portfolio tools stop at mutual funds. Your actual wealth picture includes EPF sitting in an EPFO account, NPS spread across Tier I and Tier II, PPF in a post office or bank, and maybe Superannuation from a previous employer — all growing silently in the background, none of it visible alongside your equity funds.
The Debt & Fixed Income section brings all of it in.
You import your statements — EPF passbook PDF, NPS transaction file, Superannuation statement — and the tool parses them automatically. It handles the quirks: EPF statements list interest as a separate line item by financial year; NPS has employer and employee contributions in different rows; some Superannuation statements don’t carry the trust name on every page. It deals with all of that.
Once imported, you see:
- Current corpus per instrument with annualised CAGR since inception
- Contribution history — how much went in each year from you and your employer
- Projected value at retirement — EPF at its current rate to 58, NPS market-linked projection at your chosen equity/debt split, PPF compounded at the current declared rate
- Combined debt allocation — what percentage of your total wealth is in guaranteed/quasi-guaranteed instruments vs market-linked? This feeds into the retirement planner so you’re not double-counting corpus
For NPS specifically: the tool reads the XIRR directly from your statement, compares it to what a simple equity-weighted index portfolio would have returned over the same period, and tells you the gap. NPS is mandatory for many, but knowing its actual return matters for retirement projections.
For EPF, the tool flags when your UAN passbook shows a transfer-in from a previous employer that may have a different contribution history, and whether your current interest crediting looks correct based on the running balance.
The point of all this is one consolidated number: your total retirement corpus across all instruments, updated whenever you refresh your statements. That’s the number the retirement planner uses.
A Health Score That Tells You Where You Actually Stand
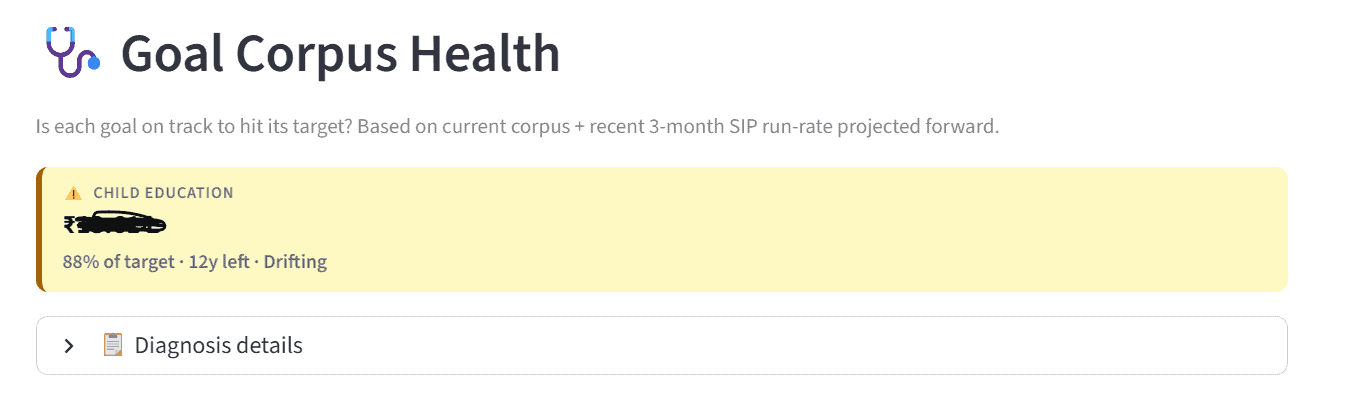
The Goal Dashboard gives every goal a health score on a 0–100 scale. It’s computed from three independent axes:
- Investment discipline — are you investing consistently, or erratically?
- Fund quality — how well are your funds tracking their benchmarks? Are they adding alpha or just mimicking an index at active-fund costs?
- Goal trajectory — given your current corpus and SIP, is the projected outcome within range of your target?
Each axis lights up in green, amber, or red. The overall score is a weighted composite. The score changes over time — you can see whether you’ve been improving or declining quarter by quarter.
This isn’t a vanity metric. When the fund quality axis turns red, it means a specific fund has stopped performing. When the trajectory axis turns amber, it means your SIP needs to increase. Each signal points to an action.
Fund Quality: Two Numbers That Replace Ten Metrics
I use a framework adapted from Pattu Sir’s freefincal methodology to evaluate fund quality with two numbers.
The first measures tracking consistency — how tightly does the fund’s returns move with its benchmark over time? Low consistency means the fund is either drifting in style or adding unnecessary risk.
The second measures margin of safety — given what the fund has historically delivered in its worst periods, does your goal have enough runway to absorb a bad stretch? This is expressed as a ratio: values above 1.0 mean you’re safe; values approaching 0.77 mean you’re close to the edge.
Both numbers are tracked quarterly and plotted as a trend. A fund that was fine two years ago but has been deteriorating for six quarters is visible immediately. You see the signal before the damage becomes irreversible.
Drill into Any Fund with One Click
The Fund Analysis section lets you examine any fund in your universe in depth:
- Factor Analysis — does the fund actually behave like what it claims to be? A “large-cap active fund” with 97% correlation to the Nifty 50 is a closet indexer charging active fees. The dashboard flags this automatically.
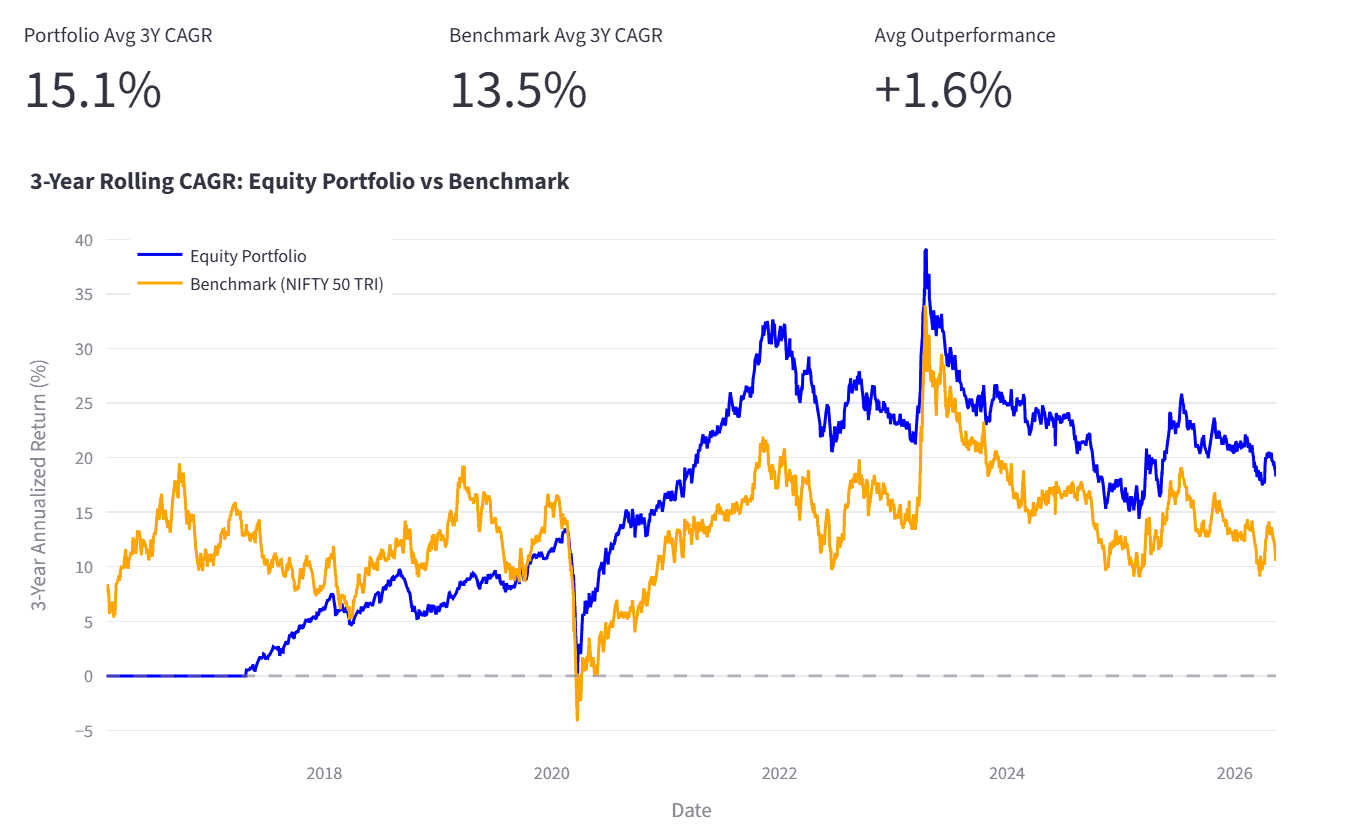
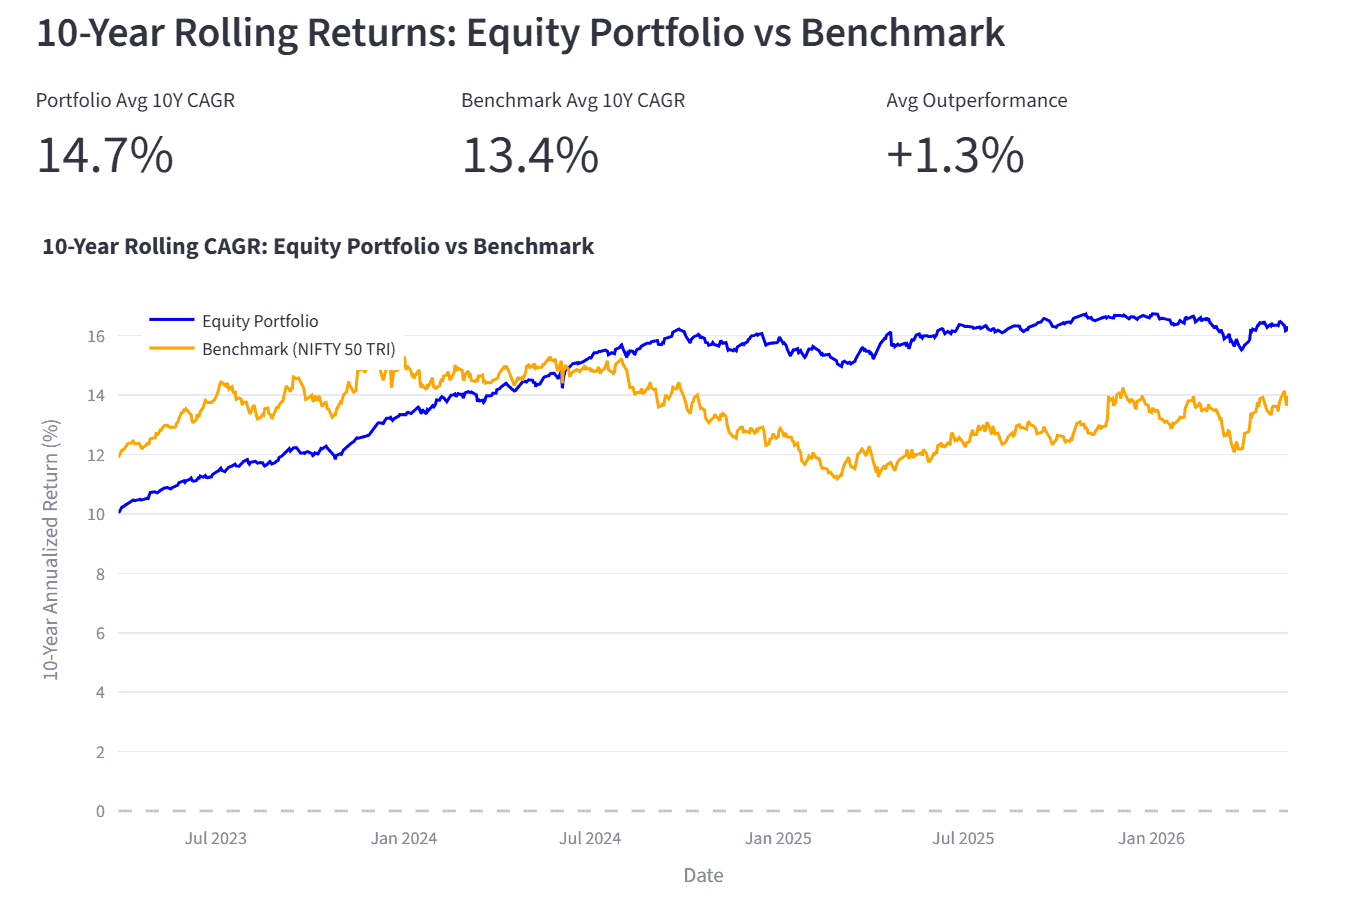
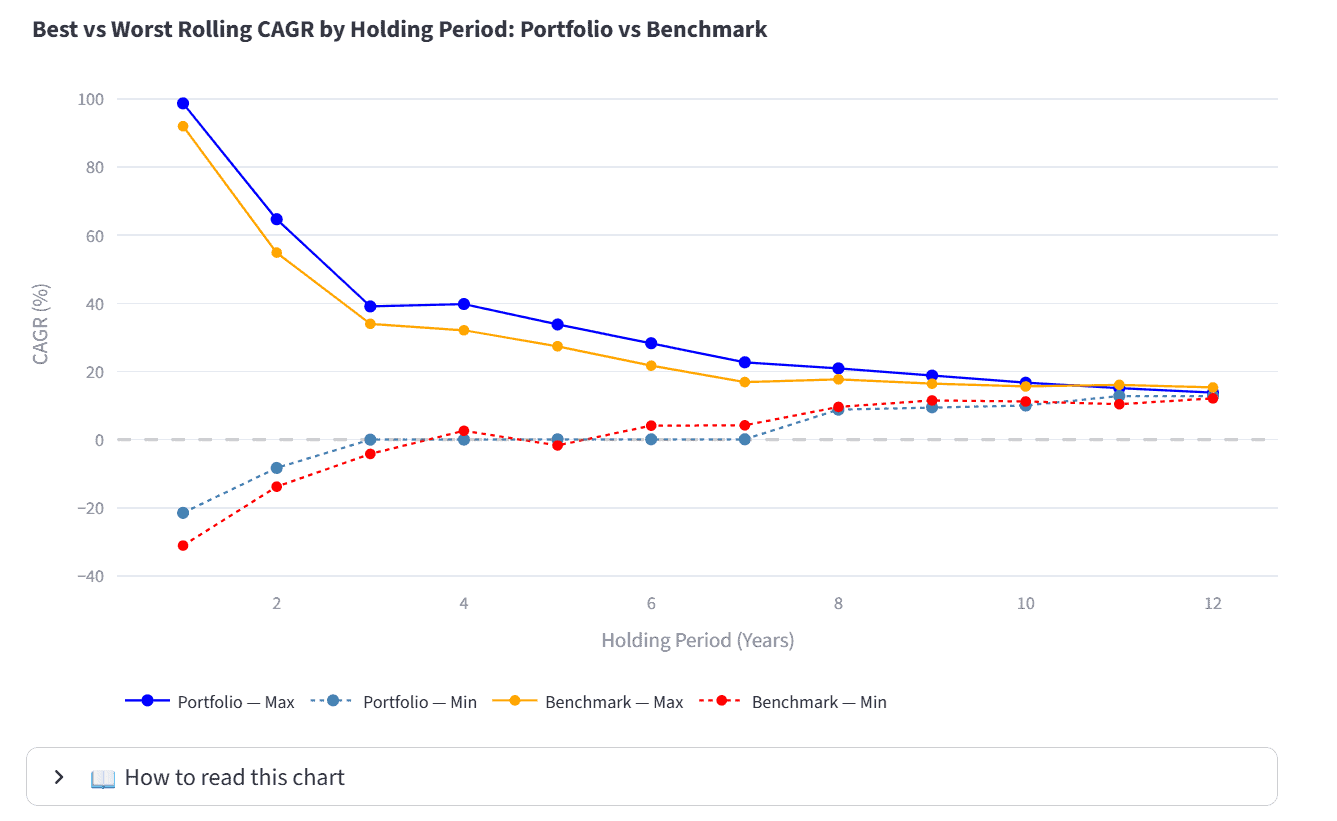
- Rolling Returns — not just 1Y/3Y/5Y point-in-time numbers, but the distribution of all 3-year rolling windows the fund has seen. Has it ever delivered below your required return over a 3-year stretch?
- Volatility Clustering — when was the fund volatile, and was it during market-wide events or fund-specific instability?
- Ulcer Index & Drawdown — a more realistic measure of investor pain than standard deviation. Which funds caused the least suffering during the 2020 crash while still delivering returns?
- Anti-fragile finder — ranks funds by their gain/loss ratio during market extremes. Useful for identifying which funds in your watchlist were genuinely robust, not just lucky.
Crash Simulator: Know What Happens Before It Does
The Crash Simulator lets you stress-test your retirement plan against real scenarios.
You configure your current corpus, monthly expenses, inflation assumptions, and expected returns. Then you run scenarios: what if markets deliver 6% for 10 years instead of 12%? What if inflation runs at 8%? What if you retire with 20% less corpus than planned?
The simulator shows you how long your money lasts, when it runs out (if it does), and what your “resilience score” is — a single number that tells you how much buffer you have against adverse outcomes. It also handles goal-based withdrawals during retirement (paying off an EMI, funding a child’s education mid-retirement) and models the house-purchase decision: when is it financially safe to commit to an EMI given your FI target?
Tax Corner: Stop Leaving ₹1.25 Lakh on the Table Every Year
The Tax Corner runs the full FIFO tax engine on your portfolio. For every fund, it knows exactly which units you hold, when you bought them, and what your cost basis is.
What it calculates:
- Unrealised LTCG by fund — which funds are sitting on taxable gains? How much of the ₹1.25 lakh annual LTCG exemption have you used?
- Harvesting suggestions — which lots can you redeem and repurchase before 31 March to use the exemption, reducing your future tax liability?
- STCG exposure — if you’re within 12 months of a large purchase, how much tax would you owe if you exited now?
- Capital gains calendar — the exact date each lot crosses the LTCG threshold, so you can plan exits optimally
For stock holdings and arbitrage funds, the same engine applies — tracking arbitrage LTCG by financial year, identifying which lots to harvest to stay under the exemption.
Retirement Planner: More Honest Than a SIP Calculator
The Retirement Planner is not a SIP calculator. It models what actually happens during both the accumulation and withdrawal phases:
- Blended returns for a mixed equity/debt portfolio, not a single average
- Expense inflation — your lifestyle expenses grow faster than CPI
- Goal-based withdrawals during retirement — not just a flat monthly draw
- What-if scenarios: what if you do a 10% annual SIP step-up? What if you delay retirement by two years?
- The Bucket Strategy simulator — model a three-bucket withdrawal approach where Bucket 1 (2 years of expenses in liquid) is replenished from Bucket 2 (medium duration), which is replenished from Bucket 3 (equity). Visualise how long each bucket lasts and when you need to rebalance.
The FI corpus calculator runs backward: given your target monthly expenses in retirement, it finds the corpus you need to sustain that lifestyle for your expected post-retirement lifespan.
Behaviour Analytics: What You Do Is Not What You Think You Do
I believe this is the most useful tool in the entire suite of tools. Everyone claims they’re risk averse or they can take risks etc but their transaction statement tells otherwise 🙂
- There is a conversation that happens in every investor community. Someone describes their portfolio, someone else asks about their risk tolerance, and they say: “I’m comfortable with volatility. I stayed invested through 2020. I can handle a 40% drawdown.”
- Maybe they can. But maybe what they mean is: “I’ve never actually seen 40% of my money disappear, and I’m projecting my tolerance from a position of comfort.”
- The Behaviour Analytics page doesn’t ask you what kind of investor you are. It reads your CAMS statement and tells you.
- SIP discipline score. It looks at every month in your investment history and checks whether a SIP was credited. Simple. Except — in February 2020, did you skip a month? What about June 2022 when markets were down 15%? What about the three months in 2021 when you were probably busy and told yourself you’d make it up? The score is binary: the money either went in or it didn’t. Over 36 months, this is revealing.
- Timing quality. Every lump-sum investment you made — a windfall deployment, a bonus, a fund switch — the tool compares that date to the Nifty’s trailing 3-month performance. Were you buying after a run-up (FOMO) or after a correction (conviction)? Across all your lump-sum investments over your entire history, the pattern becomes visible. Most investors who believe they “buy the dip” are actually buying after the recovery.
- Crash response. During every identifiable correction in your investment history (defined as a sustained drawdown of 10%+), the tool tracks what you did. Did you: continue the SIP normally, increase allocation, decrease allocation, or stop entirely? The 2020 crash is particularly diagnostic — it was sharp (40% in 6 weeks) and fast-recovering (back to highs within 6 months). Investors who paused their SIPs during those 6 weeks and resumed after the recovery had already happened paid a real cost. The tool calculates that cost in rupees.
- Idle capital. How many times did you receive a credit (salary, maturity proceeds, a redemption) and let it sit uninvested for more than 30 days? How much return did that idle period cost you? Some investors are disciplined about regular SIPs but perpetually hesitant about deploying lumpsum amounts — and that hesitance has a measurable price.
- What the AI does with this. Once the patterns are computed, the AI advisor reads them and gives you direct feedback. Not templated. Not gentle. It might say: “Your SIP discipline score is 91% — excellent — but your lump-sum timing quality is in the bottom quartile. Your last 4 lump-sum investments were all made within 2 weeks of a market recovery, after the bottom had already passed. You are buying conviction, but with a 4–6 week lag.”
- That’s the kind of feedback that actually changes behaviour — because it’s specific, it’s about you, and it’s from your own data.
- The point is not to make you feel bad. The point is that claimed risk tolerance and demonstrated risk tolerance are often two different things. Most investors don’t know which category they’re in. This page tells you.
Portfolio Chat: A Financial Advisor Who Has Already Read Your Portfolio
The Portfolio Chat is not a generic AI chatbot. Before you type the first word, it has already loaded your current holdings, goal mappings, XIRR per goal, asset allocation, and recent transaction history. It uses all of this as context for every answer.
That distinction matters enormously. Most AI tools require you to paste in your data, describe your situation, and re-explain your goals with every question. Here you just ask.
What it’s good at — data retrieval with interpretation:
“What is my total XIRR across all goals combined, and how does it compare to a straight Nifty 50 TRI investment over the same period?”
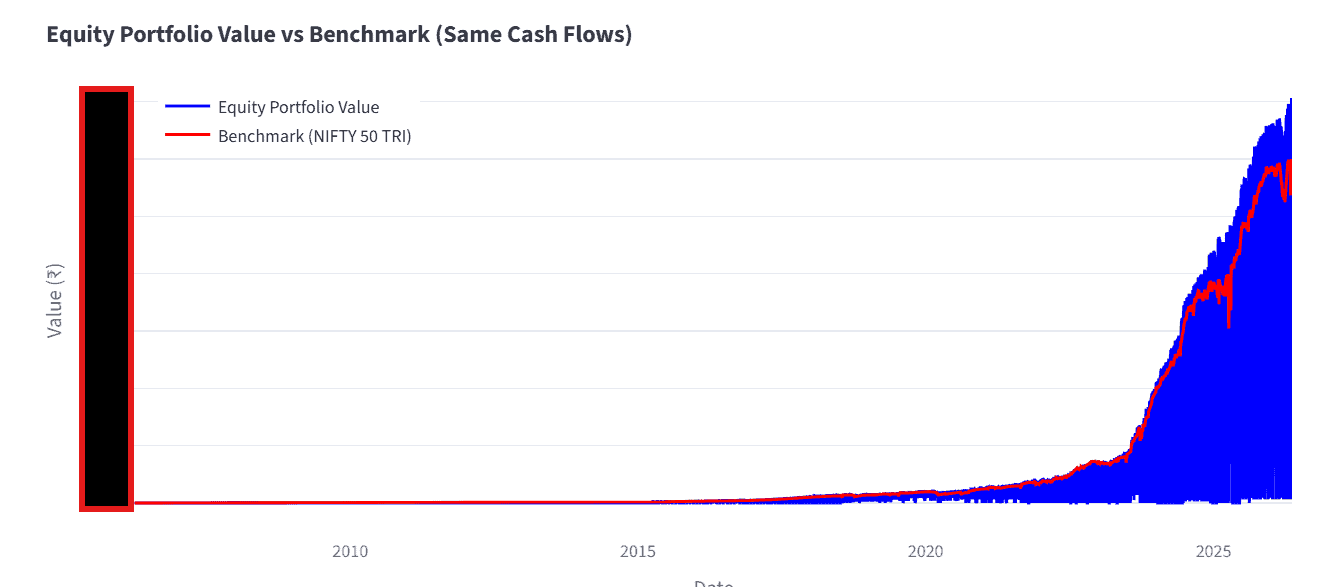
It fetches the numbers, runs the comparison, and tells you whether your active fund selection has actually added value over just buying an index fund — with your actual cashflow dates, not a theoretical lump sum.
“Which of my funds have been underperforming their benchmark for two or more consecutive years?”
It doesn’t return a table. It names the funds, quantifies the underperformance, and flags which goal those funds are mapped to — so you know the stakes.
What it’s good at — factsheet analysis:
Type the name of any fund and ask for a factsheet review. The chat fetches the latest factsheet PDF directly from the AMC website, extracts the portfolio composition using AI, and gives you a structured breakdown: top sector concentrations, top holdings, P/E ratio, overlap with your existing holdings in the same goal.
Ask “Does [Fund X]’s actual portfolio match what a flexicap fund should look like?” and it will tell you whether the fund is genuinely rotating across market caps or has quietly become a large-cap fund wearing a flexicap label.
What it’s good at — hypotheticals:
“If I stop my SIP in the Retirement goal for 6 months, what does that do to my projected corpus?”
It runs the projection with the gap and shows you the cost — not in percentage terms but in rupees and years-of-retirement.
The home screen shortcut: Four example questions sit on the home page as quick-launch buttons. Clicking one opens the chat with that question pre-filled. It’s the fastest path to the most common checks.
Ask Freefincal: A Research Assistant Grounded in 10 Years of Personal Finance Writing
M Pattabiraman’s freefincal.com is one of the most substantive personal finance resources in India — rigorous, data-driven, and free of product recommendations. Over a decade, it has published deep analyses of fund evaluation frameworks, retirement planning approaches, behavioural finance, insurance adequacy, and more.
The Ask Freefincal page is a conversational AI grounded entirely in that body of work. It is not a general-purpose chatbot that happens to know some finance. It answers using freefincal’s frameworks, cites reasoning from specific articles, and defaults to the same conservative, evidence-based perspective that characterises the site.
Why this matters: generic AI tools trained on the internet will tell you what the average financial forum says. Ask Freefincal tells you what a decade of careful Indian investor research says — on the same question.
Some questions it handles well:
- “How should I evaluate whether an active fund is worth holding versus switching to an index fund?” — it explains the K-ratio methodology and the specific tracking error thresholds Pattabiraman recommends
- “What is the freefincal view on how much equity allocation is appropriate at age 52 with a 10-year retirement horizon?”
- “My fund has a good 3Y return but I’m not sure if I should hold it — what does freefincal say about using rolling returns instead of point-in-time?”
- “Should I buy term insurance from an LIC policy or a private insurer?”
There is also a portfolio review mode: paste in your current holdings and goals, and it evaluates them against freefincal’s published criteria. Not generic advice — a direct application of a documented framework to your specific situation.
This is not affiliated with freefincal in any way. It uses publicly available articles as the knowledge base.
Decision Log: A Journal for Investment Decisions
Every investor makes decisions — to hold, to switch, to start a new SIP — that they later can’t remember the reasoning for. The Decision Log is a structured journal for those decisions.
You record:
- The decision (Buy / Sell / Hold / Rebalance / Switch / Review)
- Which goal and fund it concerns
- Your rationale (required)
- The outcome, once it’s known
Over time, the AI surfaces patterns: “You have switched funds three times in the last 18 months, always within 6 months of a market correction. In all three cases, the original fund recovered within 12 months.”
The log is also the audit trail for the annual review — when you sit down every April, you have a record of every decision you made and whether it turned out to be right.
Annual Review: One Page for Everything
Every April, the Annual Review page runs a structured review of your entire portfolio:
- Current health score vs 12 months ago — are you trending better or worse?
- Goal progress year-over-year — what changed in each goal’s corpus?
- SIP adequacy — are your current SIPs sufficient to hit each goal, or do they need to increase?
- Fund performance review — which funds underperformed their benchmark by more than 3% over the last 3 years?
- Tax harvesting opportunities — what can you do before the financial year ends?
- Fund quality across all goals — a consolidated table of tracking consistency and margin-of-safety scores
- AI-generated action list — a prioritised, portfolio-specific list of what to do this year
The whole thing is exportable as a PDF. This is the document you review with your fee-only advisor if you have one.
Alerts: Know Before It Becomes a Problem
The Alert Centre monitors your portfolio continuously and surfaces:
- Concentration alerts — any single fund or AMC exceeding a healthy portfolio weight
- Tax timing — lots approaching the LTCG threshold in the next 30 days
- Goal health deterioration — any goal whose health score has dropped significantly since the last snapshot
- Stale NAV data — funds whose prices haven’t been updated
- SIP adequacy — goals where the current SIP amount is no longer sufficient given corpus progress
Alerts are severity-ranked. A critical alert (a goal approaching its timeline with insufficient corpus) is visually distinct from an informational one (a NAV that’s 2 days stale).
What’s Next
The roadmap includes:
- Automated benchmark index data
- Multi-profile support for managing family member portfolios separately
- Net worth tracker combining real estate
- Factor-based style verification using NSE factor indices and a few more
This started as a weekend project to answer one question — am I actually on track? — and grew into something I use every week. If you manage your own mutual fund portfolio seriously and want more analytical depth than what your app provides, this is what I built for myself.
Please note: This is a paid tool and Freefincal is not associated with it in any way. This article does not constitute an endorsement. Freefincal and its authors are not responsible for any bugs/errors that the users may encounter. If you are interested in purchasing this tool, please do your due diligence and contact Krishna at srikrishnablr2022 [AT] gmail [DOT]com for more details on how to use it.