Last Updated on April 2, 2025 at 6:22 pm
Understanding the notion of a risk-adjusted return requires some maturity to think beyond mere returns. While comparing funds, a fund that offers a lower return with lower risk is better than one with higher return with higher risk.
There are many risk-adjusted measures and one of them is the information ratio. The information ratio is a measure of how effective the fund manager is in beating the benchmark.
The information ratio has always been part of the mutual fund risk-return analyzer. I started to pay more attention to it when Dr. Uma Shashikant remarked at FB group, Asan Ideas for Wealth in a thread on star ratings: “Information ratio is my key quantitative indicator”.
So that got me curious and I included a new sheet which plots the information ratio for each period in the year-on-year risk-return analyzer
🔥Secure your future with our Robo-advisory tool trusted by over 3,500 investors and advisors. From effortless retirement planning to funding your children’s biggest dreams, turn your financial goals into reality. 🔥
Subscribe for money management solutions via email! (Link takes you to our email sign-up form) Join 32,000+ readers in our community.
👉 New Tool Alert! NaviPlan: A Privacy-Focused Multi-asset Tracker and Goal Planner 👈
In this post, let us look at what the information is, how it can be interpreted, and what are its limitations. First published Apr 26 2015. Republished now with updated graphs.
What is the information ratio? It is a measure of outperformance per unit risk associated with the outperformance.
How is the Information ratio calculated?
To calculated the information ratio, the follow steps are necessary:
- Calculate daily or month returns of the fund and benchmark (I use daily returns) for a given duration.
- Calculate the difference between the two. This is known as the excess return (we hope it will be positive!)
- Calculate the average of the return difference for the duration. Call this Avg
- Calculate the standard deviation of the return difference. Call this Stdev. This is a measure of how much individual excess returns deviate from the average.
- Information ratio = Avg/Stdev
Or it is the average excess return divided by volatility associated with the excess return.
In contrast, the Sharpe ratio also calculates excess return per unit average risk but with respect to a fixed risk-free return.
Higher average excess returns and lower volatility (standard deviation) are desirable. So higher the information ratio, the better. Since the ratio depends on the duration considered, it is difficult to say what value is good.
In general, a high positive value is acceptable.
A negative information ratio implies that the numerator, the average excess return is negative. The denominator, the standard deviation is always positive.
Here is an example:
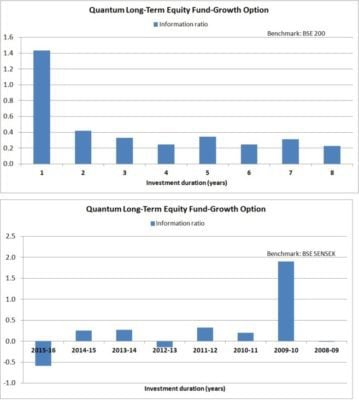
The top graph is for different investment durations: 1 year to 8 years. The bottom graph represents year-on-year information ratios.
For all investment durations, Quantum Long Term Equity has consistently produced excess returns at minimal risk.For a few years (bottom graph), the fund has not been able to produce excess returns (on average).
However, the information ratio has a flaw. A fund can have negative information ratio and could have still beat the benchmark comfortably or a fund with positive information ratio could have lagged behind the benchmark.
Take the case of HDFC Top 200. The SIP and lump sum returns for different investment durations are plotted below.
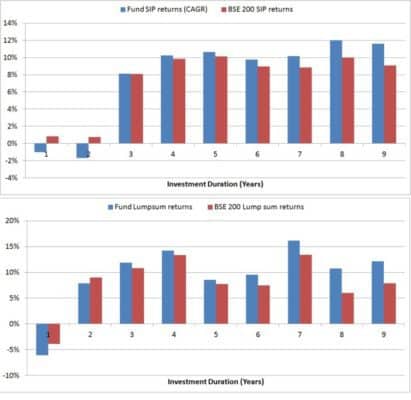
Although it does not make for spectacular viewing, HDFC Top 200 has managed to beat BSE 200 (excluding dividends!!) on many occasions.
Yet all the information ratios are negative!
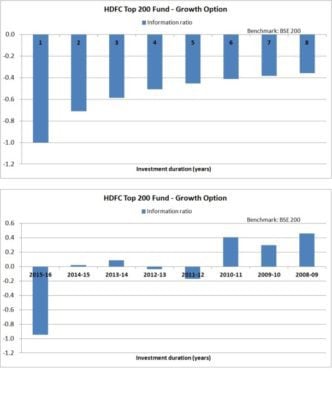
This is misleading as it suggests that HDFC Top 200 never produced excess returns wrt BSE 200 in the past 8 years.
This is because the information ratio considers the arithmetic average of excess returns and ignores the way in which the excess returns can compound and produce alpha.
The so-called geometric information ratio is the way out of this discrepancy.
The geometric information ratio for HDFC Top 200 is computed below
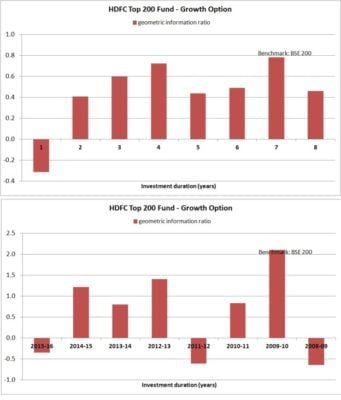
For all investment durations (except the last Y – top graph) the geometric information ratio is positive.The geometric version is a better estimate of risk-adjusted returns.
This tool is now part of the freefincal investor circle.