Last Updated on December 29, 2021 at 6:18 pm
A reader asks, “Dear Pattu Sir, as pointed out by you several times, active large cap funds have struggled to beat the Nifty/Sensex over the last few years. Although things are a little better after the market recovery in the last few months, will this be the norm in the future too? Does this mean game over for active large cap mutual funds?”
To try and answer this objectively (and not like a passive investing fanatic), let us consider the ratio of an equal weight index with its market capitalization-weighted counterpart.
Before we begin, the reader must appreciate that there are two different questions to address here: (1) “Is it game over for active large cap funds?” refers to the fund performance alone. (2) “Does it still make sense for investors to invest in active large cap funds?” should be considered separately. We shall do so towards the end of this article.
As pointed out earlier, popular indices like the Nifty or Sensex suffer from concentration risk. That is, just a handful of stocks (top 5-10) determines the bulk of their weight (50-60%).
🔥Secure your future with our Robo-advisory tool trusted by over 3,500 investors and advisors. From effortless retirement planning to funding your children’s biggest dreams, turn your financial goals into reality. 🔥
Subscribe for money management solutions via email! (Link takes you to our email sign-up form) Join 32,000+ readers in our community.
👉 New Tool Alert! NaviPlan: A Privacy-Focused Multi-asset Tracker and Goal Planner 👈
An actively managed large cap fund must (after mid-2108) invest at least 80% of their portfolio in the top 100 stocks by market capitalization. In general, for an active fund manager to beat the Nifty 50, many stocks in the top 100 must perform well. In principle, if this happens, a fund investing in the same 50 stocks as the Nifty can beat it by choosing different weights.
If only the top 5/65 stocks of the Nifty perform and the rest of the large caps or the rest of the market keep moving down as we saw from Jan 2018 to Mar 2020, then it would be tough for active fund managers to beat the Nifty.
We had earlier considered the return difference between the Nifty 50 or NIfty 100 Equal-Weight Indices with the NIfty 50 or NIfty 100 to measure the market imbalance. This was the situation in Dec 2019: Return difference of Nifty 50 vs Nifty 50 Equal-weight index at an all-time high! In an equal-weight index, the 50 or 100 stocks all have more or less the same weight removing the possibility of concentration risk.
Let us now consider the ratio NIfty 100 Equal Weight Index (TR) divided by Nifty 100 TRI and the same for NIfty 50. This ratio is normalized to 1st Jan 2003 for the N100 indices and 30th June 1999 for the N50 indices.
First, let us look at NIfty 50 Equal-Weight TRI divided by Nifty 50 TRI. Higher the value of these ratios, the higher the opportunities for choosing performing stocks from beyond the NIfty 50 or Nifty 100 top 10 or top 15 stocks.
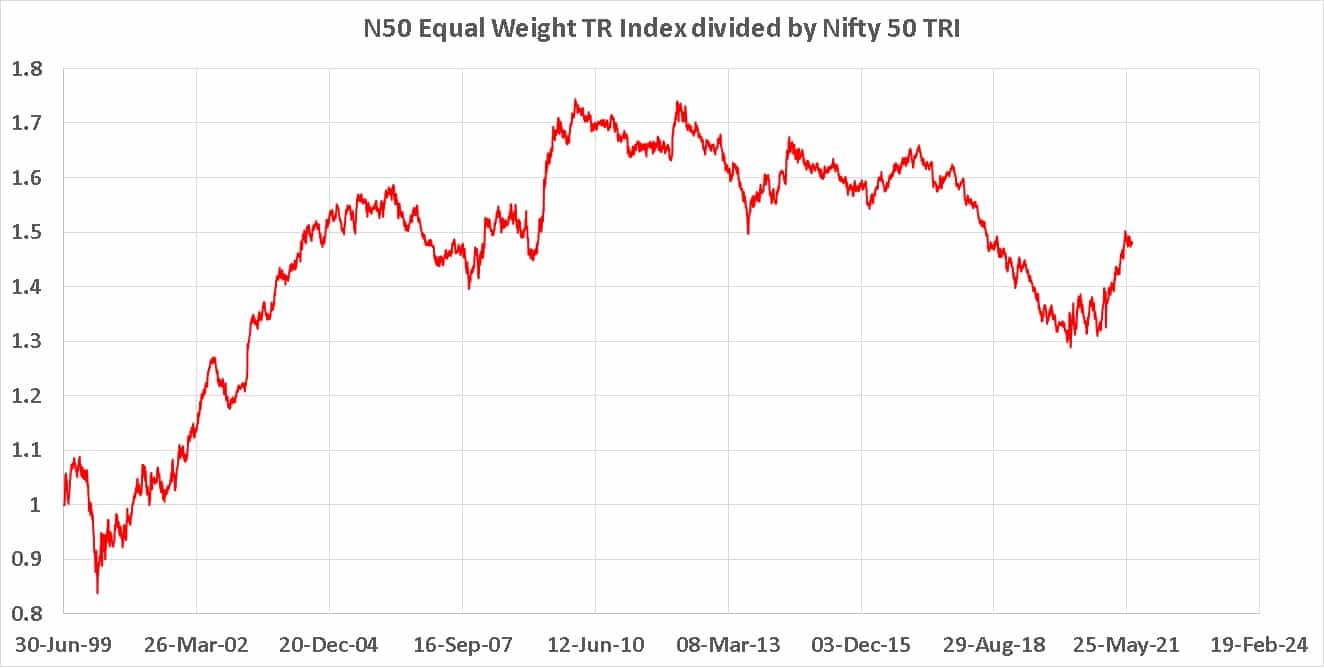
N50EW/N50 peaked almost ten years ago and has been falling since. After the market crash in March 2020, there was a reversal. See: Market crash destroys imbalance among Index stocks. You may have noticed active large cap funds doing a bit better after the market recovery.
This is because opportunities beyond the top few stocks became available again. The ratio is currently still lower than the highs seen 10/11 years ago. This could be at least one of the reasons for the results presented here: Active mutual funds struggle to beat Nifty 50 for the last seven years! And here: Poor performance of active mutual funds: Is this a recent development? And here: Only Five Large Cap funds have comfortably beat Nifty 100!
The N100EW/N100 ratio has seen more ups and downs. All time-time was seen in Jan 2018 (3). The reversal (2) and recovery (1) is also seen here.
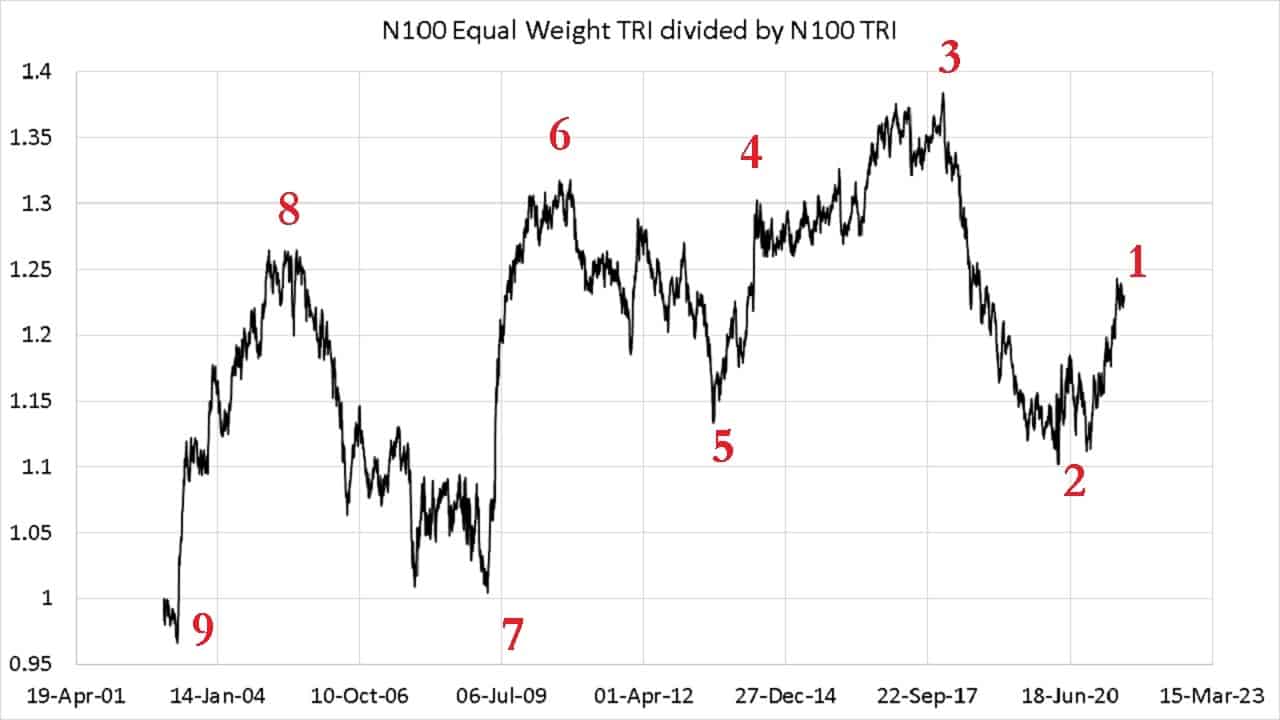
We shall investigate the performance of active large caps at the nine highlighted places in the above graph. The number of outperformers is shown in the top table below, and the corresponding percentage of outperformers in the bottom table.
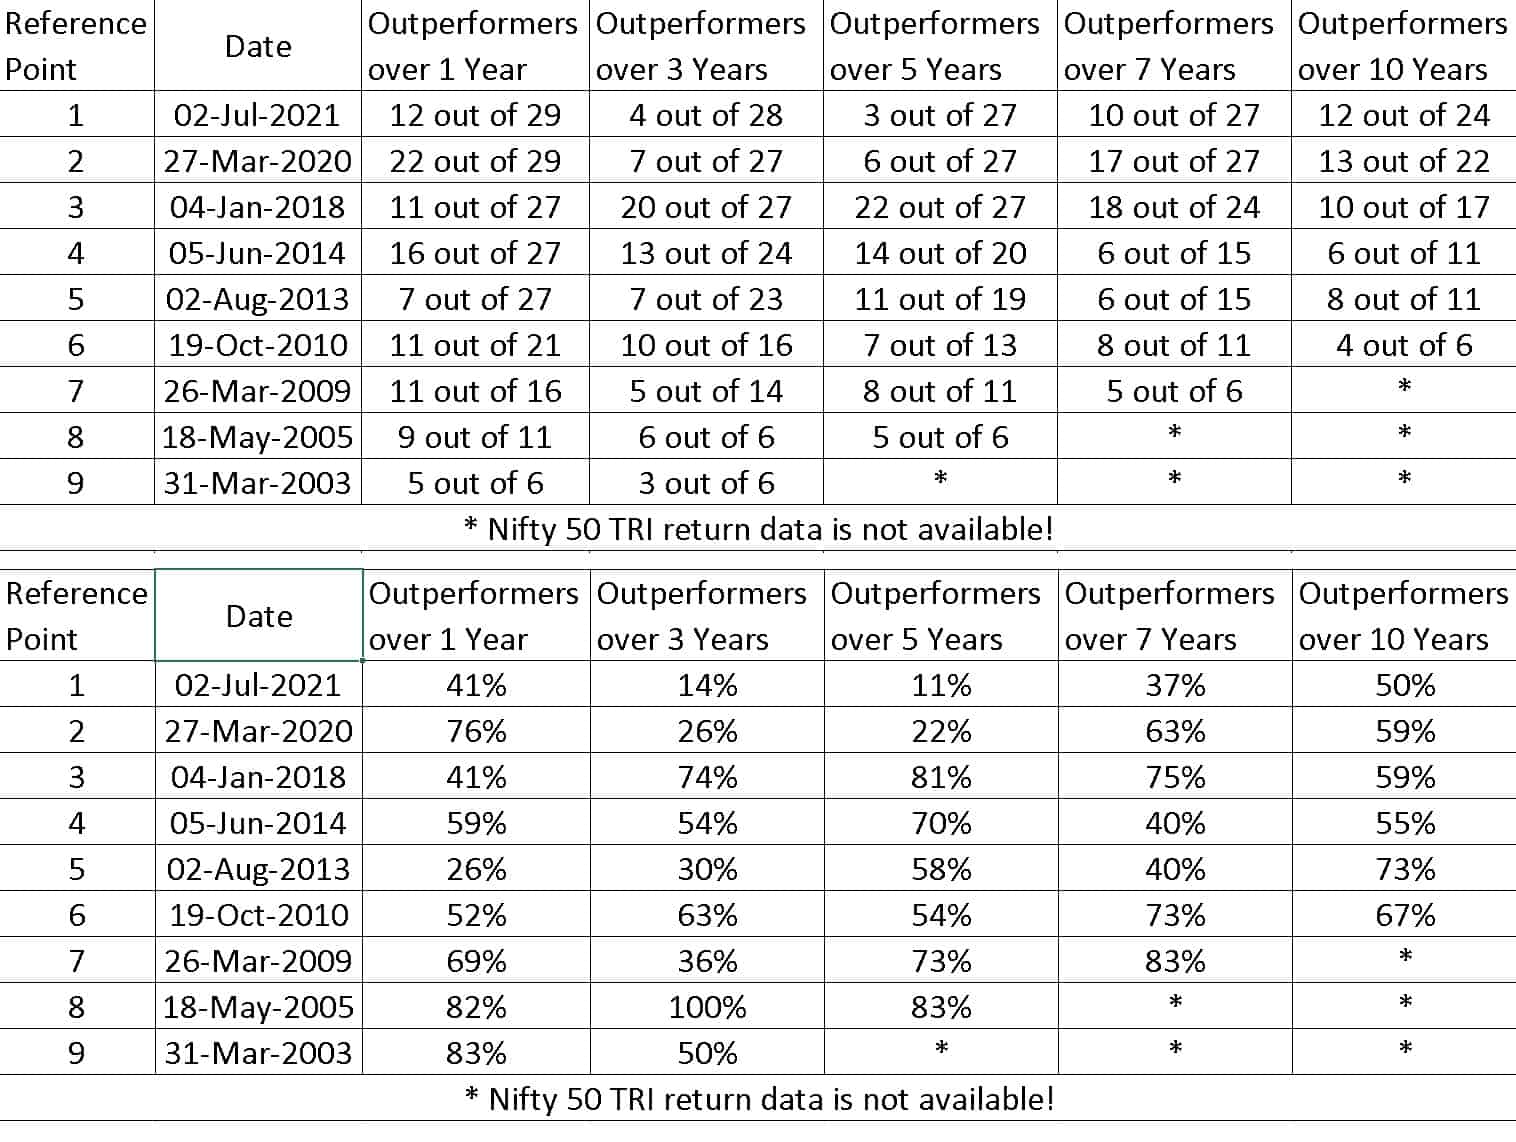
The N100EW/N100 ratio has peaked at points 3, 6 and 8. At the last one (8), the large cap fund sample size is too small. At 3 and 6, the long-term performance has been reasonably good. It was easy to spot active large cap outperformers.
This correlation need not mean causation, but it does tell you that stock-picking opportunities in the large cap universe are possibly cyclic. And even if this is causation, it only tells us that the reason for outperformance is not because of fund manager skill but because of the natural ups and downs of the stock market!
Also, notice at any point in time, there were a good number of underperformers.
So, Is it game over for active large cap mutual funds? No. We could see new all-time highs of the N100EW/N100 ratio in future, and in the period preceding this, many active large cap funds could outperform the Nifty or Sensex. We can know this only in hindsight.
However, this does not mean it makes sense for investors to choose active large cap funds. Investors should appreciate the cyclic nature of outperformance, and it can be extremely frustrating to hold active large caps. This can also be seen from the Two-year rolling return difference between Nifty 50 Equal-Weight TRI and Nifty 50 TRI.

The two-year rolling return difference between Nifty 100 Equal-Weight TRI and Nifty 100 TRI is shown below. All we know (from hindsight) is there are ups and downs. There is not frequency or wavelength here for us to predict the future.

In summary, we could see a resurgence of active large cap funds in future. However, it can be extremely frustrating and expensive for investors to go through these cycles of outperformance and underperformance. This would be mean constantly looking for funds with better returns or more stars.
There would always be some active funds that beat the index – see, for example, 582 US Large cap funds outperformed S& P 500 over the last 10 years – the problem is due to the cyclic nature of opportunities the funds we hold would cycle from good and bad, but the fees would be constant! It is from this perspective index funds are a better choice.