
Last Updated on January 10, 2023 at 9:55 pm
Mutual fund investing can be stressful for many investors. The Ulcer index offers a way to measure this stress!bv
The mutual fund risk and return analyzer now has a separate sheet for Ulcer index analysis. In this post, we evaluate the utility of this risk-return metric by considered a few popular mutual funds.
The standard deviation is a measure of deviations from an average. Both positive and negative deviations are accounted for. However since a positive deviation from an average implies a higher NAV, it is not a ‘bad’ thing. So why penalise it?
Why not penalise only the negative deviations? Thus was born many measures of ‘downside’ risk. The mutual fund risk and return analyzer already has two downside metrics: the downside deviation and the downside capture ratios. With the inclusion of the ulcer index, the analyser now uses 20 metrics to assign a risk-return score to each mutual fund.
🔥Secure your future with our Robo-advisory tool trusted by over 3,500 investors and advisors. From effortless retirement planning to funding your children’s biggest dreams, turn your financial goals into reality. 🔥
Subscribe for money management solutions via email! (Link takes you to our email sign-up form) Join 32,000+ readers in our community.
👉 New Tool Alert! NaviPlan: A Privacy-Focused Multi-asset Tracker and Goal Planner 👈
The Ulcer index is one such measure of downside risk.
Suppose the maximum NAV over a 2-week period is 15. If the NAV decreases from this maximum, the Ulcer index value increases pointing to an increase in investor stress! If the NAV increases further, the index decreases reflecting a decrease in stress!
The Ulcer index is designed in such a way that it penalizes downside (fall from the maximum) much more than other ratios. It was first published by Peter Martin and Byron McCann in their book The Investors Guide to Fidelity Funds (1989).
Peter Martin describes the index in his page: tangotools. The out of print book in pdf form can be found here.
At that time pretty much everyone thought stomach ulcers were caused by stress. We later came to know that stomach Ulcers are caused by bacteria – a Nobel prize winning discovery. Of course, the name Ulcer index stuck!
Now let us try out the ulcer index with a few mutual funds.
Higher the ulcer index, lower the downside protection and higher the investor stress.
So we require a fund which has an ulcer index consistently lower than that of its benchmark.
The mutual fund risk and return analyzer evaluates ulcer index in three ways using a duration of 90 business days. Although this is much longer than the two week period recommended by Martin, the higher duration cuts out noise and should be good enough for the long term investor.
- An average ulcer index value is computed and is used as part of the risk-return score calculation. To see some samples of this calculation, see this post
- The ulcer index is plotted for different dates and compared with fund NAV and benchmark value movement.
- The number of times the ulcer index of the fund was lower than its benchmark for 1-8 year periods is computed as a percentage.
We will first focus on the plots in this post.
Let us start with something simple:
ICICI Pru Dynamic Equity
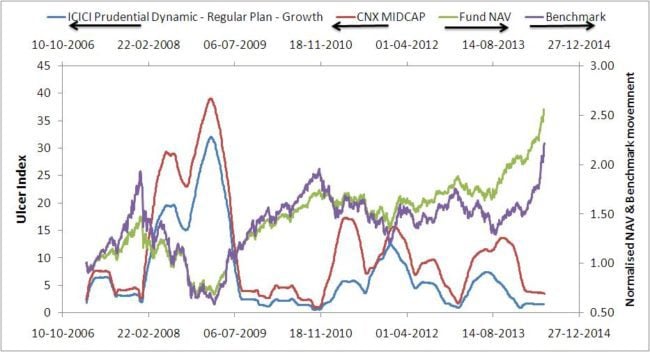
The ulcer index values for the fund and benchmark are plotted wrt the left axis. The fund NAV and benchmark values are plotted wrt right axis, see the arrows on top of the graph.
Notice that the funds ulcer index values are pretty much always lower than the benchmarks. This implies that the fund has excellent downside protection. Investors in this fund would be a relaxed lot!
The large peak in the ulcer index represents the behaviour during the 2008 crash when downside protection was non-existent and investors were pretty stressed out.
ICICI Focussed Blue Chip Equity

Again investors would be quite happy with this one as its ulcer index is consistently lower than the benchmarks. Early days though!
Mirae Asset India Oppurtunities Fund
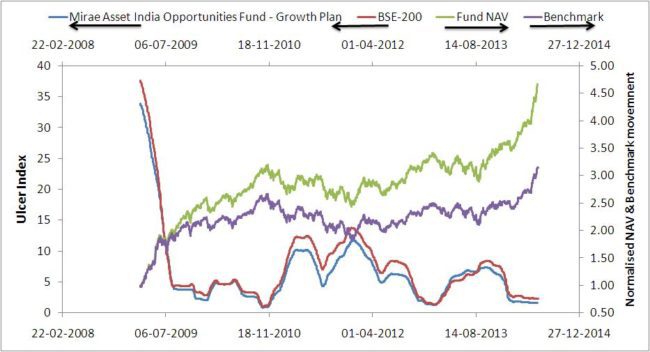
Again relaxed investors because of consistent downside protection. Again early days though!
UTI Opportunities
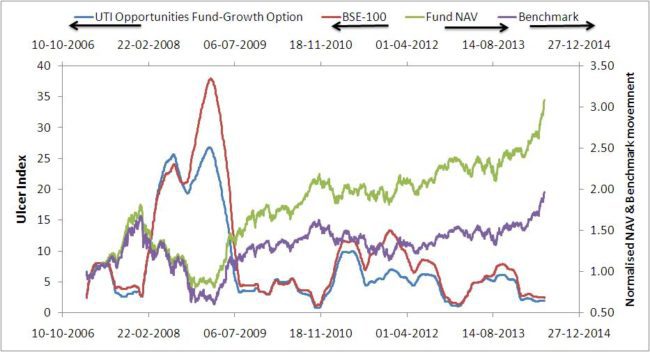
Very good history of downside protection. Again relaxed investors.
Franklin India Blue Chip Fund
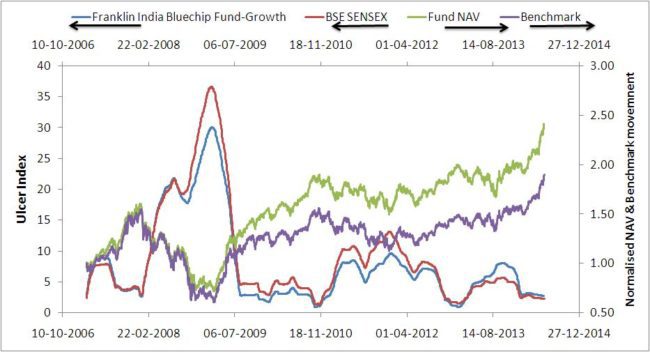
Good history of downside protection but seems to have slipped recently. Should have many investors worried about future performance!
HDFC Top 200
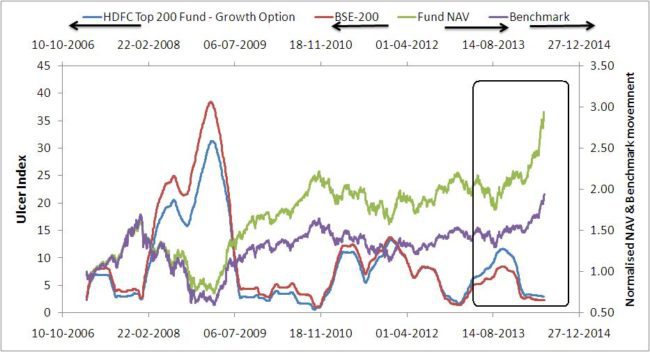
Now for Top 200. The downside protection seems to have vanished from end of 2011! Even during the recent rally (rectangular region) fund does not have enough downside protection. So this implies higher returns at higher risk. Not a good thing!
Quantum Long Term Equity
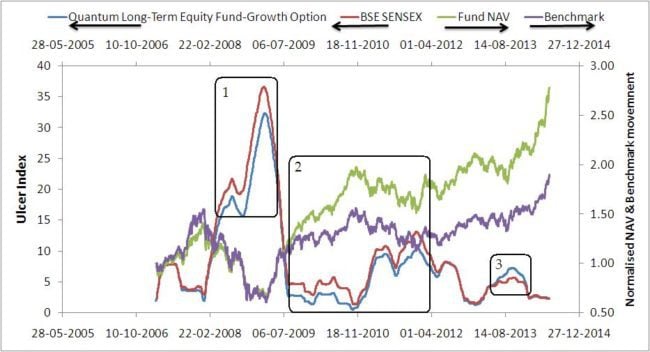
Now let us look at three regions.
region 1: Good downside protection during the 2008 crisis
region 2: excellent downside protection during the sideways market
region 3: A slip just before the recent rally.
All in all, pretty reasonable.
Reliance Growth
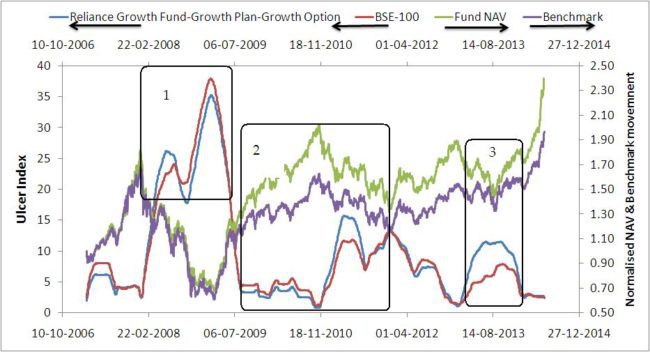
Nothing spectacular here. Would have given investors a very stressful time! Doesn’t seem to have a consistent track record of downside protection. To me, the biggest drawback of this fund.
There you have it. The ulcer index gives you insights on the downside protection history of a fund. As far as I am concerned this is the most important attribute of an actively managed fund. We pay high expense ratio only for this. Downside protection is the real source of alpha.
What do you think?
This tool is now part of the freefincal investor circle. Join the investor circle! Enjoy a 50% discount for a limited time and pay only Rs. 3000 with discount code circle50. You can get lifetime access to several unique tools, discussion forums, and bug fixes.