Last Updated on August 30, 2021 at 3:49 pm
The Nifty50 Value 20 Index or the NV 20 represents the 20 most liquid value blue chip stocks selected from the Nifty 50 index. The performance of this index is analysed and compared with the performance of actively managed large-cap mutual funds.
Nifty50 Value 20 Index Selection Criterion
The 50 stocks that are part of the Nifty are arranged in ascending order as per the following:
Stocks with low PE and PB receive a higher rank with weights of 0.3 and 0.2 respectively.
🔥Secure your future with our Robo-advisory tool trusted by over 3,500 investors and advisors. From effortless retirement planning to funding your children’s biggest dreams, turn your financial goals into reality. 🔥
Subscribe for money management solutions via email! (Link takes you to our email sign-up form) Join 32,000+ readers in our community.
👉 New Tool Alert! NaviPlan: A Privacy-Focused Multi-asset Tracker and Goal Planner 👈
Stocks with high ROCE (return on capital employed) and Div Yield receive a higher rank with weights of 0.4 and 0.1 respectively.
The final rank is assigned by combining the above the two rules and the top 20 stocks comprise the Nifty50 Value 20 Index.
Detailed Methodology Document of Nifty50 Value 20 Index
NV 20 – factsheet
Download List of Nifty50 Value 20 Index (.csv)
Nifty50 Value 20 Index vs Nifty 50 Total Returns Index
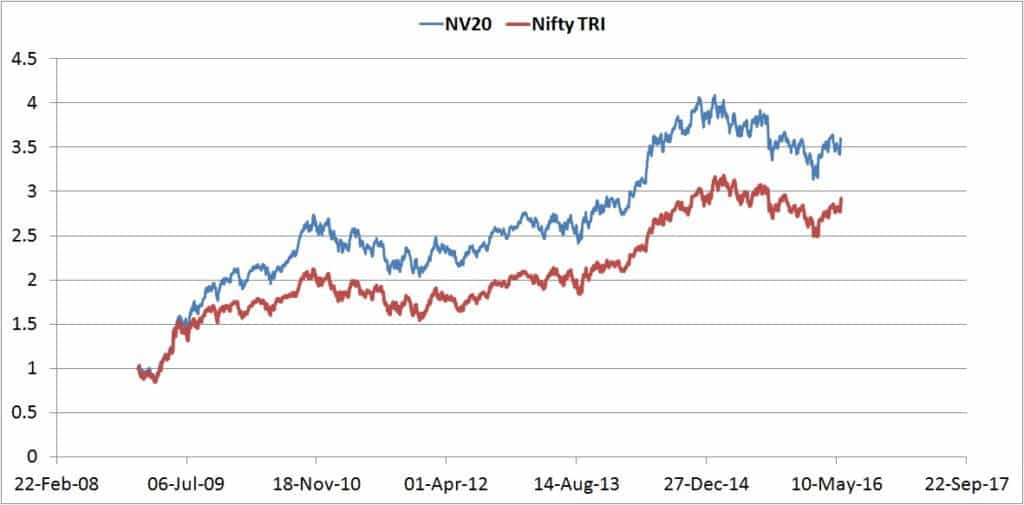
The NV 20 (price index) has comfortably beat the Nifty 50 with dividend reinvested. Therefore, the NV 20 is much sterner mutual fund benchmark for large cap mutual funds (and imo perhaps for equity-oriented balanced funds too)
Large-cap fund screener indexed to NV20
I have made a large cap screener with returns, downside capture and upside capture measured with respect to the NV 20. This sheet was possible only because of the awesome VBA skills of Pranav Date who wrote a code to match VR fund name and category with AMFI code. His work has paved the way for some exciting developments. More on this soon.
Regular readers may recall that similar batch analysis but with individual benchmarks for the mid-cap category and balanced funds (wrt Nifty TRI) was published earlier.
Downside Capture Ratio of all Mid-cap Equity Mutual Funds
CRISIL Balanced Index: a benchmark for balanced mutual funds
The batch analyser for large cap funds (Excel windows) and the results sheet (compatible with all spreadsheets) is available below.
Here is a sample screen with funds with a greater 7Y lump sum return than the NV20. This was randomly chosen.

You can notice (click on the image to enlarge) that these funds have also beat the NV 20 for lower durations and in SIP and lump sum mode.
Consistent outperformance wrt NV 20 combined with low downside capture ratio and/or capture ratio > 1 can be one way to select large cap mutual funds.
The NV 20 TRI is not available in the public domain. When it is, it will be a better benchmark.
You can consider using this guide for mutual Fund Screening with Downside and Upside Capture Ratios
The batch analyser: Mutual-Fund-Downside-protection-Batch-analysis-Large-cap-Mar-2016-new
The results sheet: large-cap-funds-vs-NV20-results
The NV 20 is part of the strategic indices from the NSE (quant based and not cap based). I shall gradually include the key indices in the mutual fund analysis sheets.