Last Updated on April 14, 2026 at 11:04 am
Each December, I conduct a personal finance audit. As part of this years audit, I thought of updating my mutual fund investment journey, in particular, the rise and fall of my retirement corpus.
The idea behind this post is not to boast or claim how intelligent my investing strategy is. It is only to study volatility and perhaps point out that simple solutions are enough to achieve early financial freedom.
About 60% of my retirement corpus is in equity mutual funds and rest in NPS. Although in principle I can retire (don’t want to), in practice I cannot. A good chunk of my corpus is locked in NPS and I cannot get it out unless I buy an annuity for 80% of it! What a bum deal! Which is why I earlier wrote: Stay away from Corporate NPS, if You Wish to Retire ASAP!
Early retirement in India is difficult but not impossible. All one needs to do is to systematically invest as much as possible for at least 10-15Y (10 in my case). For those who understand the basics of portfolio management, any old “2/3-star” mutual fund will do. Those interested in financial freedom can check out this free e-book: E-book: How to retire early in India. Oher e-books are here.
🔥Secure your future with our Robo-advisory tool trusted by over 3,500 investors and advisors. From effortless retirement planning to funding your children’s biggest dreams, turn your financial goals into reality. 🔥
Subscribe for money management solutions via email! (Link takes you to our email sign-up form) Join 32,000+ readers in our community.
👉 New Tool Alert! NaviPlan: A Privacy-Focused Multi-asset Tracker and Goal Planner 👈
My first ever equity investment was on 19th June 2008. I had no idea about the 2008 crash because I was not looking.
This is the normalised growth of my equity retirement corpus along with total investment amount.
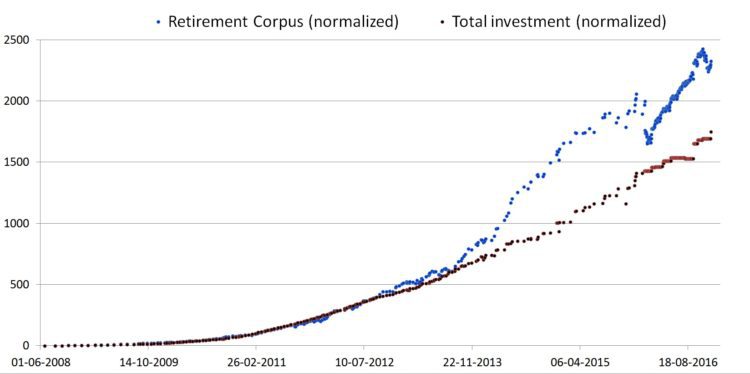
The dips or discontinuities in the investment curve represent rebalancing events. I have deducted the entire redemption from the investment amount. This is not correct, but deducting capital gains associated with a redemption is messy and I am not interested in that for now.
The key personal insight from my insignificant investment journey is:
embrace a sideways market and put in as much as possible without worrying about “dips”.
This graph conveys this lesson effectively.
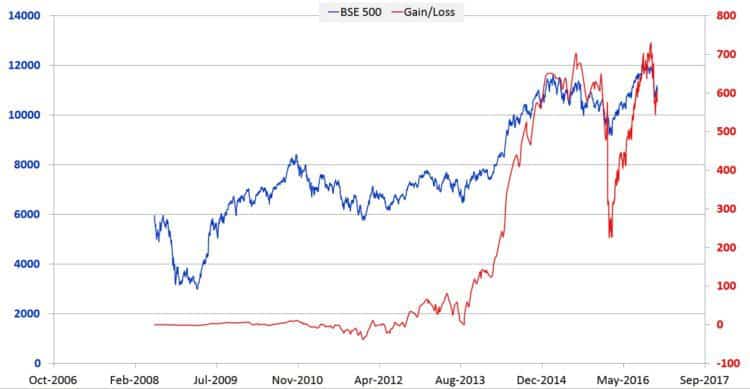
Notice for about the first five years, my equity portfolio was red, and then when the market moved up, notice the steep increase in gains. Each day (when the market moved up, of course!), my portfolio gained by an amount equal to a month investment. That was just amazing to watch.
Of course, such parties do not last long. Notice the steep fall and recovery earlier this year. The best way to handle these gains and losses is to not look! Get rid of that money control app, get out of Asan Ideas for Wealth if we get confused by people who describe a 1% fall as a carnage.
My normal retirement is still years away, so I am not too worried about these ups and downs for now. Of course, a person who wants to retire early must (a) manage risk (much) better and (b) must change asset allocation.
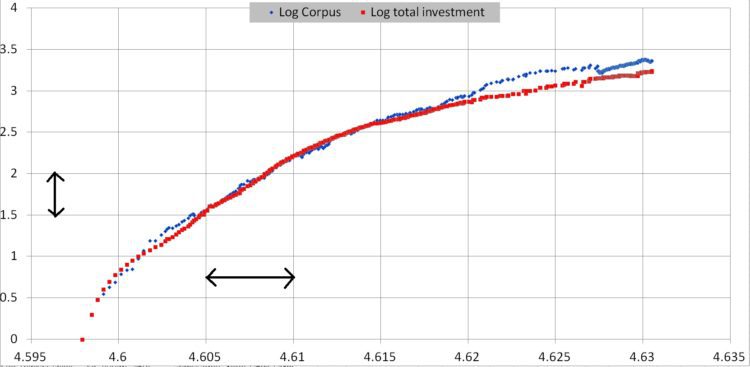
This is a log-log plot. That is, both the Y-axis and X-axis are plotted on an equal interval scale. Each rectangle in the grid has the same width (x-axis – time) and height (change in corpus and investment). Notice that gradual slow-down in the growth of both curves. This is because, I rapidly changed my asset allocation from 100% fixed income to 40% fixed income in the space of about 2-3 years. Naturally, I will have to slow down after that!
If you wish to learn more about the benefits of log plots, see: Are you ready to climb the Sensex Staircase?!
Returns do not matter!
The net XIRR of the equity portfolio is 13.88%. Does not matter whether this is big or small. All I need to worry about is,
What is my corpus worth today?
Readmore: Review Your Financial Freedom Portfolio in Seven Easy Steps
As long as I am comfortable with the answer to the above question, I don’t care about star ratings, peer comparison etc. One can actively manage an investment portfolio along with systematic investing.
I have compiled My lessons from mutual fund investing.
Would you like to analyse your portfolio this way?
I started this exercise with an aim to make a tool that will generate the above plots automatically. This is possible if a user can generate a list of all transactions with the following columns
Date; instrument name*; transaction type**; amount; NAV or market price.
* Fund name or stock name
** Purchase, redemption or dividend.
Can you generate such a table from any of the online portfolio trackers? Please let me know. If yes, I can easily make this an automated tool.
utual Fund Review: PPFAS Long Term Value Fund
Check out Reviews for You Can Be Rich Too
Twelve reviews are now available for our new book, You Can be Rich with Goal-based investing. Couple of samples:
This is perfect book on personal finance. Very nicely explained about taxation about debt mutual fund. Topics like early investing and asset allocation are very well explained.
“A must read for every beginner , or even for a seasoned investor , who are lost somewhere in the process. Each chapter is so nicely explained with no jagrons , be it related to Insurance , Investment , Taxation or Mutual Funds.
And at the end calculators are just an eye opener when you put the real numbers , that makes the end Icing on the cake”. By shavneet on 16 November 2016
Check out the other reviews and buy now via Amazon.in for Rs. 399. Or via Infibeam for just Rs. 307. Jeethendra tells me infibeam delivers faster.
The book is also available on Kindle at Amazon.in (Rs. 244.30) or at Amazon.com ($3.36 or Rs. 244.30).
Request to Write a Review
If you have read the book, please review it at Amazon/Flipkart/Infibeam/Google Play. It will make us better writers