Last Updated on June 3, 2022 at 6:50 am
A reader writes, “I read with interest your series on market timing. You mentioned that sequences of risk are common to both systematic investing and market timing. Can you please give a simple example of this?”.
To those who have not read the series, the article mentioned above is this: A risk in market timing that 122 years of backtesting failed to reveal! Now, what is all this about the “sequence of returns risk“?
We see examples of this all around us. For example, those who thought Jos Butler would score big in the final and his team his because he did all through the tournament would be disappointed. There are several instances of teams winning every match up to the final and losing it.
These are all examples of the hot hand fallacy. We see something great happening and expect it to happen after we commit money or emotion to it. One aspect of sequences of returns risk can be called the hot hand fallacy.
🔥Secure your future with our Robo-advisory tool trusted by over 3,500 investors and advisors. From effortless retirement planning to funding your children’s biggest dreams, turn your financial goals into reality. 🔥
Subscribe for money management solutions via email! (Link takes you to our email sign-up form) Join 32,000+ readers in our community.
👉 New Tool Alert! NaviPlan: A Privacy-Focused Multi-asset Tracker and Goal Planner 👈
Retirement planning is where sequence risk matters the most. A retiree looking at the returns of a “balanced advantage” fund decides to park a big chunk of his nest egg there and start an SWP (or worse opt for the monthly dividend option).
After he invests, there is an extended period of market turmoil. There is no good news to drive the market up or no bad news to bring it down. The next look sabha elections results in a hung assemble and the govt does not see through a full term. The currency is weak and inflation high. All this results in quicker erosion of his corpus than expected. He exits the fund and runs to the safety of fixed income but the damage has been done. He has trouble matching his expenses with his income.
The above is again a form of hot hand fallacy. However, the sequence of returns risk can strike in different ways. Here is an example discussed before. The NAV of DSP small cap fund is shown below. The yellow patch refers to 15 SIPs each started a month apart. The corresponding end dates are represented by the green patch.

The SIP returns are tabulated below. Notice the huge spread in returns – sequence risk at play. This is again a clear demonstration of the fact that SIPs do not reduce risk or enhance returns!

Experienced investors know sequence risk as “In equity, when you start investing matters; When you stop investing (or stop to compute returns) also matters”.
The above examples are taken from this article: Huge difference in SIP returns from the same fund! How is it possible? Also, see The Blind Men and the Mutual Fund!
Now let us get to the UTI momentum fund. Let us consider two friends A and B. A invested a lump sum in UTI Nifty 200 Momentum 30 Index fund (direct plan) on March 11th 2021. B found out about this investment a little later and invested a lump sum in the same fund two months later on May 11th 2021.
On 027th May 2022, they decided to compare their returns.
- A got an absolute return of 18.26% compared to a 10.11% return of Nifty 200 TRI. Not too shabby.
- B got an absolute return of 3.40% compared to a 9.98% return of Nifty 200 TRI.
They found this baffling. Their fund returns were so different but the benchmark returns were nearly the same!
As we keep saying, returns are point to point; the risk lies in the journey. So let us explore the journeys.
March 11th to May 27th 2022: A’s journey
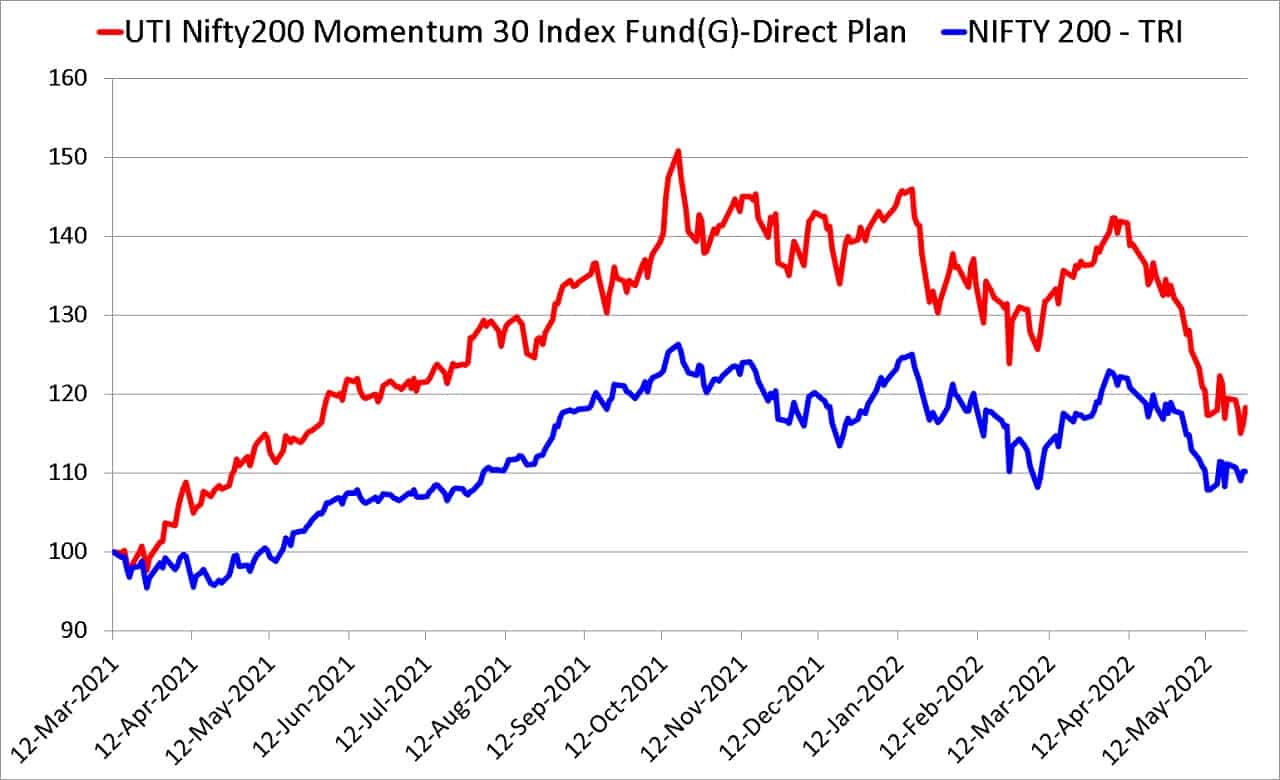
You can see that the absolute gain today does not tell the full picture. The fund has been losing its gain over the index for several months now.
May 11th to May 27th 2022: B’s journey
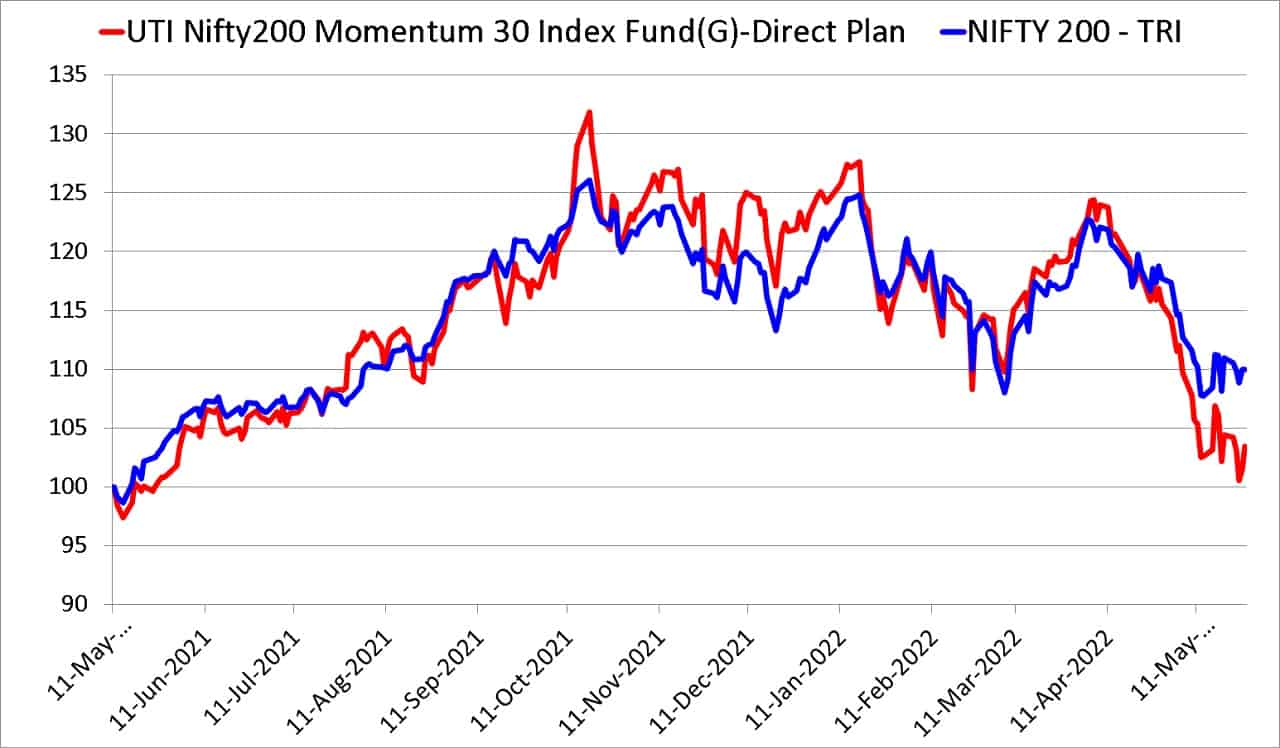
Just two months after A started, the fund could only move along with the index, dropping below in the last few days. This also illustrated the perils of momentum investing. What goes up comes down fast! See: UTI Nifty200 Momentum 30 Index Fund: Who should invest?
March 11th to May 11th 2021: the intervening period
A’s entire gain came from March 11 to May 11 2021!
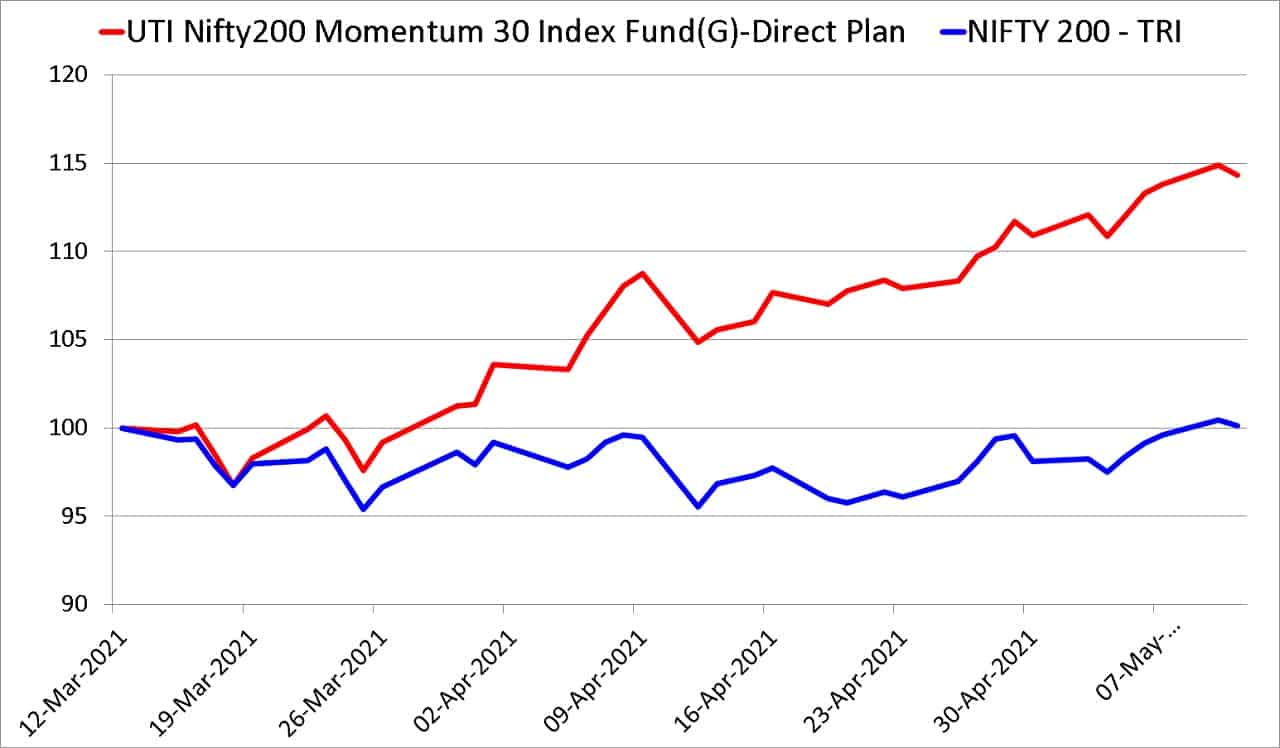
The above graphs tell us why A and B’s returns (and journeys) are so different. The entire gains made by A were made in the first two months. During this time the benchmark did not move much explaining why its returns are the same for both investors.
During the duration of B’s investment, A suffered too but his initial gains were too high for this loss to be noticeable. This is the sequence of returns risk at play. Different investors putting money in the same fund can have different returns and the market does not have to crash for this to happen!
What is the origin of sequence risk? Equity market returns are clumped. As we saw above, A enjoyed two great months with the fund and 12 poor months. B missed out on those two great months and suffered. That is, some months the returns are excellent, some months the returns are poor and some months so-so. Which months we encounter in our journey defines our gains.