Last Updated on August 6, 2025 at 4:43 pm
While investing periodically for long-term goals, an investor should be aware of two factors:
- The power of compounding oh-hum, boring! I am sure most people reading this are tired of see how a small investment grows to an unimaginably large value … after several decades!
- Volatility Most of us must invest in volatile instruments like equity in order to ensure our returns (post-tax!) are higher than inflation (also volatile!). The trouble with volatility is that it can destroy the fruit of compounding.
Therefore, understanding volatility, and containing using intelligent measures it is crucial for long-term goals.
In this post, we will discuss a technique known as dynamic asset allocation and discuss two ways of doing this.
This post is inspired by the new fund offer from DSP Black Rock: Dynamic Asset Allocation mutual fund using the Yield Gap method.
Join 32,000+ readers and get free money management solutions delivered to your inbox! Subscribe to get posts via email! (Link takes you to our email sign-up form)

🔥Want to create a complete financial plan? Learn goal-based investing? Exclusive access to our DIY tools? Increase your income with your skills? Use this link to enjoy massive discounts on our robo-advisory tool & courses! 🔥
Note: This is not an advertisement for any mutual fund. It is presented only as evidence of the author’s ongoing efforts to educate himself.
First, let us first list the steps to be adopted by every long-term investor.
- Invest as much as possible
- Invest as often as possible
- Understand the importance of volatility and how to contain it –Keep calm and carry on!
- Diversify across asset classes: invest in equity but do not forget debt
- Diversify within an asset class: spread your equity investments across market caps and geographies
- Periodically modify asset allocation: Changing equity and debt percentages to minimize volatility – the subject of this post.
- Taxation: Never forget taxation
- Quit while ahead: When you near your goal, get out of volatile instrument when the going is good.
If the first three tasks are in motion, the rest will follow.
Now, let us discuss about periodic changes to asset allocation.
I. Rebalancing a portfolio each year is the simplest way to do this. If we start with a 60:40 equity:debt allocation and find that it is 65:35 after an year, you could rebalance it back to 60:40. This way you have preserved the gains by shifting it from a more risky asset. For this to be successful, one must have the maturity to invest more in equity when it underperforms.
I have dealt with rebalancing techniques in reasonable detail. To know more, check out:
- The What, Why, How and When of Portfolio Rebalancing With Calculators to Boot
- Portfolio Rebalancing –Volatility Simulator
II. Permanent portfolio A delightfully simple way to contain volatility is the Permanent portfolio method. Invest in Stocks, Bonds, Gold and Cash in equity proportion (25%) and rebalance each years. I have not checked returns after taxes but the portfolio has a remarkable downside protection: The Permanent Portfolio: A Fascinating Low-Volatility Option For The Long Term Indian Investor?
III. The P/E model
The P/E ratio or the price/earnings ratio is simply the share price divided by earnings per share in the last 12 months. Although variations of this definition exist, this should suffice for our purposes.
If the P/E ratio is high, the share is ‘priced’ higher than the value received from it. That is earning profit from the share is an expensive task.
If the P/E ratio is low, the share is ‘priced’ lower than the value received from it. That is it is cheaper to earn a profit from the share.
There is much more to it. You will soon recognise that I am cherry picking explanations that suit me!
For a single share, it is difficult to ascertain what a high or low P/E is, as there are many other factors at work.
However, the P/E ratio of an index, “the total price of the index divided by its total earnings”, has been used as a reference to buy low and sell high.
That is, buy when the P/E is low and sell when it is high. The logic behind is rather easy to understand.
The P/E ratio is high (overpriced) when the index stocks are priced higher than what they are worth (higher earnings higher worth). Therefore, decrease equity exposure since one can expect prices to fall.
Similarly the P/E ratio is low (underpriced) when the index stocks are priced lower than their worth. Therefore, increase equity exposure since once expect prices to increase.
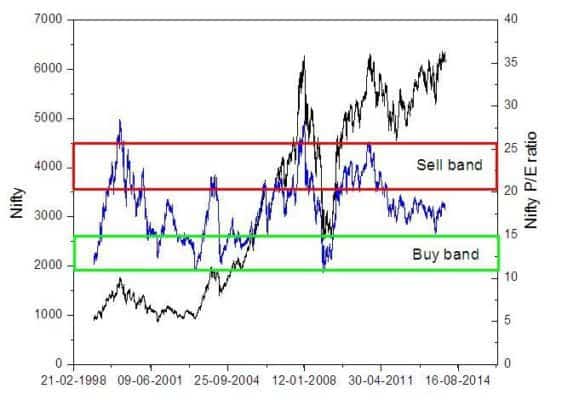
The advantage of this strategy becomes clear when historical Nifty data is plotted along with it P/E ratio (blue curve; right axis)
Data Source: Nifty and Nifty P/E
The green rectangle is the ‘buy-band’ when one should increase equity exposure to maximise profit and the red rectangle the ‘sell-band’ when one should decrease equity exposure to minimise loss.
It should be clear enough that this strategy minimise volatility and preserves the fruit of compounding.
Instead of waiting for the P/E to hit the green or red rectangles to change equity exposure, what if the asset allocation is modified more dynamically?
That is what the FT India Dynamic PE Ratio Fund of Funds does!
This is a fund of fund that invests in Franklin India Bluechip Fund (equity component) and Templeton India Income Fund (debt component – G-Secs, PSU Bonds and Corporate debt).
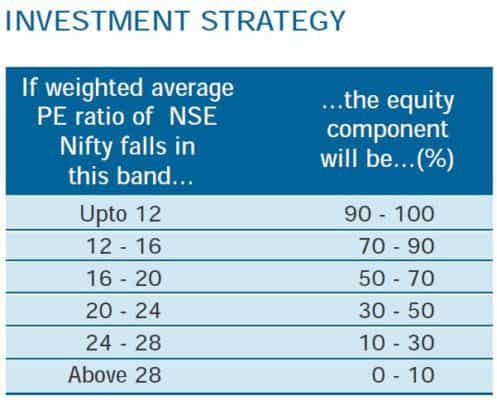
Each month it adjusts its asset allocation in the following way
Source: Fund Brochure
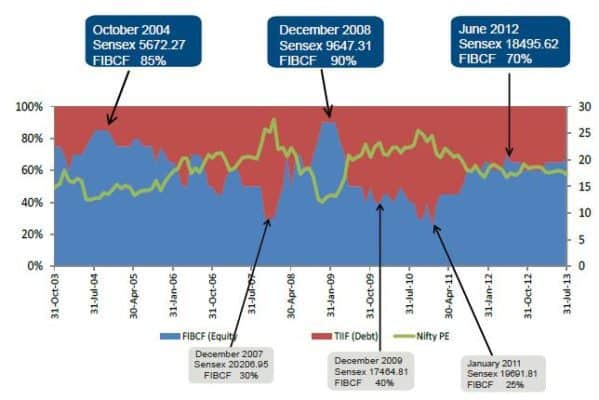
Here is an example of this strategy at work
Source: Fund Brochure
IV Yield Gap Model
In the P/E model, the value of stocks are evaluated with their price to earnings ratio. Instead of doing this, what if the price of the equity index is evaluated with respect to the debt index?
That sound reasonable does it not? Which brings us (finally!) the yield gap model.
For simplicity I will use the definition used for DSP BlackRocks Dynamic Asset Allocation fund
Yield gap = (10 year Govt. Securities yield) X (P/E Nifty index ratio)
The 10-year G-sec yield can simply be thought of as a measure of debt interest rate movement. Again an oversimplification, but should do for our purposes.
When the G-sec yield is high, or when interest rates increase, the corresponding bond prices will become low. This is because, a bond will have to adjusted to match prevailing interest rates. Therefore, if rates increase, the bond prices will have to be lowered to match the current rate if they are sold. Read more about this here
Therefore, higher G-sec yield implies bond prices are cheap and interest rates are high. A good time to invest in debt.
A higher P/E index ratio implies a good time to sell equity.
A lower G-sec yield implies a good time to get out of debt. A lower P/E index ratio implies a good time to buy equity.
Combine the two by taking their product, you have the yield gap.
As general thumb rule,
Yield gap < 1: low P/E, low G-sec yield. Shift from debt to equity
Yield gap > 1: high P/E, high G-sec yield. Shift from equity to debt
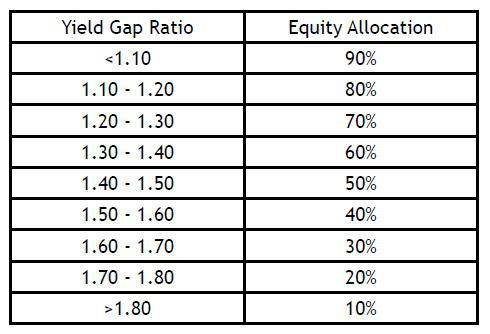
The NFO from DSP BlackRock proposes to invest in a set of equity funds and debt fund from DSPBR with an asset allocation governed by the yield gap
Source: Scheme Document
When there is not much of a difference in yield between 10-year and 1-year G-secs, the scheme will use the 1-year G-sec yield for calculating yield gap.
Which is better ? Dynamic asset allocation using the P/E model or the yield gap model?
Unsurprisingly DSPBR proclaims the superiority of the yield-gap model in its NFO presentation.
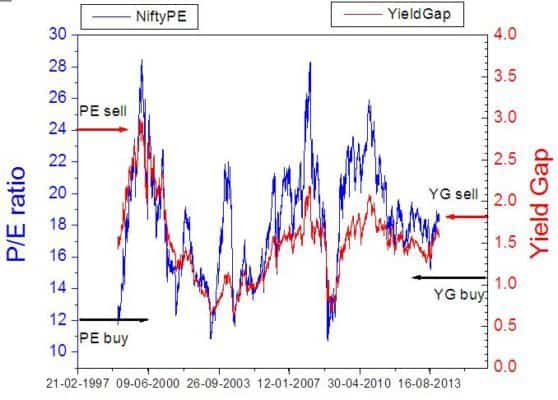
Notice how the low volatility of the yield gap curve compared to the P/E curve surrounding the 2008 market crash. While this requires further investigation, the following curve that I put together is reasonably instructive.
Data Source: Nifty P/E, 10Y G-sec yield
Nifty P/E ratio (blue curve, left axis) is plotted along the Yield Gap (red curve; right axis). The 10% equity allocation limit is marked as buy for the PE and Yield Gap fund-of-fund strategies mentioned above. Similarly, the 90% equity allocation limit is marked as sell. Download link of excel file containing Nifty PE, 10 year G-sec, and yield gap data is given below.
Just by observing both curves one notices that the YG curve is less volatile than the PE curve.
Notice that the YG model recommends a sell (on equity) much before the PE model. Similarly, it also recommends a buy earlier than the PE model.
Therefore, we can expect a portfolio which dynamically changes asset allocation as per the YG model to be less volatile than the PG model. This appears to corroborate with chart presented by DSPBR.
An early sell call is good for preserving compounding. How about an early buy call? This could mean that we buy before the bottom most-point of a crash. Perhaps this will affect gains, but personally, I like the YG model better.
Note 1: As of 27th Jan. 2014, The Nifty P/E is 17.85. The 10 year G-sec yield is 8.770%. The yield gap therefore is 1.57.
Note 2: There is a 78% correlation between P/E and YG. Therefore, using the P/E model is certainly not a terrible idea. The YG model can be taught of as a refinement to the P/E model. After all YG depends on the P/E!
Note 3: A Fund of funds is taxed like a debt fund. Their expense ratios are usually high.
Note 4: The PE model fund of funds from Franklin Templeton has not beat the Sensex since inception. If you are young and if your goals are far away should you not be investing more aggressively?
What do you think? Do you agree? Will you consider investing in such dynamic asset allocation mutual funds?
Download the 10-year G-sec, Nifty P/E and Yield Gap file.
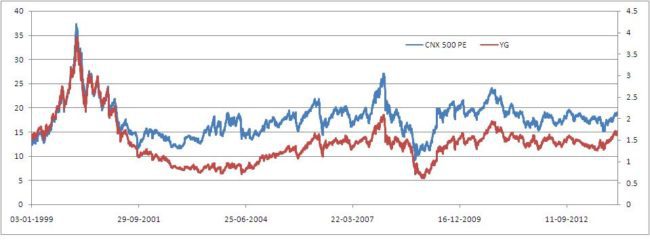
CNX 500 P/E and YG calculated with it as request by Soma in the comments section. Let me know if you need the data file for this.

Use our Robo-advisory Tool to create a complete financial plan! ⇐More than 3,000 investors and advisors use this! Use the discount code: robo25 for a 20% discount. Plan your retirement (early, normal, before, and after), as well as non-recurring financial goals (such as child education) and recurring financial goals (like holidays and appliance purchases). The tool would help anyone aged 18 to 80 plan for their retirement, as well as six other non-recurring financial goals and four recurring financial goals, with a detailed cash flow summary.
🔥You can also avail massive discounts on our courses and the freefincal investor circle! 🔥& join our community of 8000+ users!
Track your mutual funds and stock investments with this Google Sheet!
We also publish monthly equity mutual funds, debt and hybrid mutual funds, index funds, and ETF screeners, as well as momentum and low-volatility stock screeners.
You can follow our articles on Google News

We have over 1,000 videos on YouTube!

Join our WhatsApp Channel



- Do you have a comment about the above article? Reach out to us on Twitter: @freefincal or @pattufreefincal
- Have a question? Subscribe to our newsletter using the form below.
- Hit 'reply' to any email from us! We do not offer personalised investment advice. We can write a detailed article without mentioning your name if you have a generic question.
Join 32,000+ readers and get free money management solutions delivered to your inbox! Subscribe to get posts via email! (Link takes you to our email sign-up form)
About The Author
 Dr M. Pattabiraman (PhD) is the founder, managing editor and primary author of freefincal. He is an associate professor at the Indian Institute of Technology, Madras. He has over 13 years of experience publishing news analysis, research and financial product development. Connect with him via Twitter(X), LinkedIn, or YouTube. Pattabiraman has co-authored three print books: (1) You can be rich too with goal-based investing (CNBC TV18) for DIY investors. (2) Gamechanger for young earners. (3) Chinchu Gets a Superpower! for kids. He has also written seven other free e-books on various money management topics. He is a patron and co-founder of “Fee-only India,” an organisation promoting unbiased, commission-free, AUM-independent investment advice.
Our flagship course! Learn to manage your portfolio like a pro to achieve your goals regardless of market conditions! ⇐ More than 3,500 investors and advisors are part of our exclusive community! Get clarity on how to plan for your goals and achieve the necessary corpus no matter the market condition!! Watch the first lecture for free! One-time payment! No recurring fees! Life-long access to videos! Reduce fear, uncertainty and doubt while investing! Learn how to plan for your goals before and after retirement with confidence.
Increase your income by getting people to pay for your skills! ⇐ More than 800 salaried employees, entrepreneurs and financial advisors are part of our exclusive community! Learn how to get people to pay for your skills! Whether you are a professional or small business owner seeking more clients through online visibility, or a salaried individual looking for a side income or passive income, we will show you how to achieve this by showcasing your skills and building a community that trusts and pays you. (watch 1st lecture for free). One-time payment! No recurring fees! Life-long access to videos!
Our book for kids: “Chinchu Gets a Superpower!” is now available!


Must-read book even for adults! This is something that every parent should teach their kids right from their young age. The importance of money management and decision making based on their wants and needs. Very nicely written in simple terms. - Arun.Buy the book: Chinchu gets a superpower for your child!
How to profit from content writing: Our new ebook is for those interested in getting a side income via content writing. It is available at a 50% discount for Rs. 500 only!
Do you want to check if the market is overvalued or undervalued? Use our market valuation tool (it will work with any index!), or get the Tactical Buy/Sell timing tool!
We publish monthly mutual fund screeners and momentum, low-volatility stock screeners.
About freefincal & its content policy. Freefincal is a News Media organisation dedicated to providing original analysis, reports, reviews and insights on mutual funds, stocks, investing, retirement and personal finance developments. We do so without conflict of interest and bias. Follow us on Google News. Freefincal serves more than three million readers a year (5 million page views) with articles based only on factual information and detailed analysis by its authors. All statements made will be verified with credible and knowledgeable sources before publication. Freefincal does not publish paid articles, promotions, PR, satire or opinions without data. All opinions will be inferences backed by verifiable, reproducible evidence/data. Contact Information: To get in touch, please use our contact form. (Sponsored posts or paid collaborations will not be entertained.)
Connect with us on social media
- Twitter @freefincal
- Subscribe to our YouTube Videos
- Posts feed via Feedburner.
Our publications
You Can Be Rich Too with Goal-Based Investing
 Published by CNBC TV18, this book is designed to help you ask the right questions and find the correct answers. Additionally, it comes with nine online calculators, allowing you to create custom solutions tailored to your lifestyle. Get it now.
Gamechanger: Forget Startups, Join Corporate & Still Live the Rich Life You Want
 This book is designed for young earners to get their basics right from the start! It will also help you travel to exotic places at a low cost! Get it or gift it to a young earner.
Your Ultimate Guide to Travel
 This is an in-depth exploration of vacation planning, including finding affordable flights, budget accommodations, and practical travel tips. It also examines the benefits of travelling slowly, both financially and psychologically, with links to relevant web pages and guidance at every step. Get the PDF for Rs 300 (instant download)