Last Updated on May 12, 2025 at 10:17 am
Last week I had posted a comparison of large cap funds with few relevant indices. This time let us do the same with mid-cap funds – compare SIP and Lump Sum returns over the last 1,2,3,4,5,6,7,8,9 years.
As before, a passive mutual fund is just an index (either cap-based or strategic). The expenses associated with investing in such a passive fund are ignored so that it is that much harder for active funds to beat them. Therefore, no ETFs or index funds are included in this study.
Nifty Next 50 (price index)
The top 51 to 100 in terms of market cap traded at the NSE. Not exactly a mid-cap index, but I was curious. See why: Evaluating the Nifty Next 50 as an Index Fund

🔥Secure your future with our Robo-advisory tool trusted by over 3,500 investors and advisors. From effortless retirement planning to funding your children’s biggest dreams, turn your financial goals into reality. 🔥
Subscribe for money management solutions via email! (Link takes you to our email sign-up form) Join 32,000+ readers in our community.
👉 New Tool Alert! NaviPlan: A Privacy-Focused Multi-asset Tracker and Goal Planner 👈
Above 3Y a good 70% of mid-cap funds have outperformed. Not bad. This excludes dividends though.
Nifty Free Float Mid Cap 100 (price index)
This defines a mid-cap by calculating the number of actively traded shares, excluding those held by promoters, the govt. etc. Read more here. Stocks are among the bottom 25% in terms of free-float market cap (excluding the bottom 10%). Nifty 50 stocks are excluded. Principal Index Fund tracks this. This is a better representative of the mid-cap segment than other NSE mid-cap indices (50, 150)
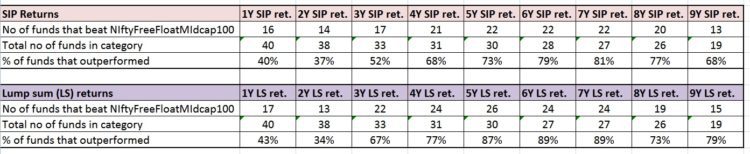
Here too, similar story. But excluding dividends.
BSE Mid Cap (Total returns index)
This represents the 71% to 85% of the average daily total market capitalization of the BSE.
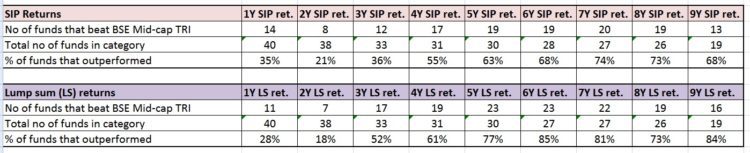
hmm interesting!
BSE Select Mid Cap (Total returns index)
Thiry largest and most liquid from the above index are part of this.
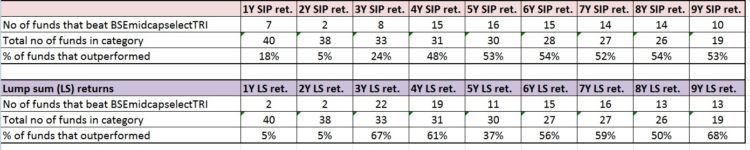
Now, what do we have here! Somebody should create an index mutual fund based on this index. That is impressive. A good ~ 50% of mid-cap funds could not beat this index.
Caveat: this was launched only in Jun 2015. Much of this data is back-calculated. Will this performance repeat in real-time? Watch this space 🙂
You Can Be Rich Too Offers


My new book with PV Subramanyam, published by CNBC TV 18
The book comes with 9 online calculator modules to create your own financial plan.
Amazon Now 33% off Hardcover ₹ 267 (prime) ₹ 307 (normal)
Kindle (₹ 244.30)
Infibeam ₹ 280 with Coupon BS10
Googe Play Books App Store (₹ 244.30)
What Readers Say
A must book for everyone who wants to take control of personal finance. Nice explanation of how a debt mutual fund works. Bonds trading and indexation benefits in high inflation years were something new I learnt. After reading this book you will be able to easily choose any funds, because you will know what that fund does or how that fund works By Amazon Customer on 17 December 2016
You can read all reviews here