Last Updated on May 12, 2025 at 10:17 am
When it comes to an actively managed market linked instrument, the ideas of downside protection and upside performance are easy enough to understand and expect.
In particular, with respect to active mutual funds, downside protection refers to the fund’s losses when compared to benchmark losses. For example, during a period in which the benchmark dropped by say 10%, we expect the fund to lose less (after expenses, as always). So if the funds has lost say, 8%, then we can say that fund has captured 80% of the benchmark losses.
If the fund has lost say, 12%, the fund has captured 120% of the benchmark losses(!!). This is referred to as downside capture and is a measure of downside protection. Lower the downside capture, the better.
Similarly, during a period in which the benchmark has gained 10%, we expect the active fund to gain more. Say, 12%. Then it has captured 120% of the benchmark gains. If has gained only 8% then it has captured only about 67% of the benchmark gains. This is referred to as upside capture and is a measure of upside performance. Higher the upside performance, the better.
🔥Secure your future with our Robo-advisory tool trusted by over 3,500 investors and advisors. From effortless retirement planning to funding your children’s biggest dreams, turn your financial goals into reality. 🔥
Subscribe for money management solutions via email! (Link takes you to our email sign-up form) Join 32,000+ readers in our community.
👉 New Tool Alert! NaviPlan: A Privacy-Focused Multi-asset Tracker and Goal Planner 👈
Capture Ratio = Upside performance/ Downside protection
Higher the capture ratio of a fund, the better. It can be viewed as managed-reward per unit managed-risk. As seen below, there are a few funds that have extremely good downside protection and poor upside performance and vice-versa. This can result in unusually high capture ratios.
Regular readers may be aware that not only I prefer using these ratios for fund selection, but also provide a monthly listing of 1Y to 9Y data.
Past posts on upside and downside capture
Dec 2016: Equity Mutual Fund SIP, Lump sum returns (1-9Y) & capture ratios
Simplify Mutual Fund Analysis with Upside/Downside Capture Ratios
Understanding Upside and Downside Capture ratios
How Mutual Fund Upside and Downside Capture Ratios are calculated.
Nine-Year Returns Vs Upside Capture

Notice that there is no correlation between upside performance and returns.
Nine-Year Returns Vs Downside Capture
The same is true for downside protection vs returns too.
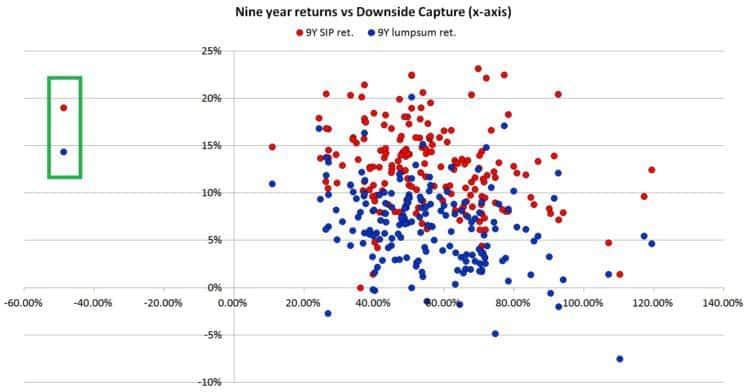
The outlier represented by the green rectangle is DSP Microcap. It has exceptionally good downside protection – positive returns when the benchmark gave negative returns. Resulting in a negative downside capture.
Nine-Year Returns vs Capture Ratio
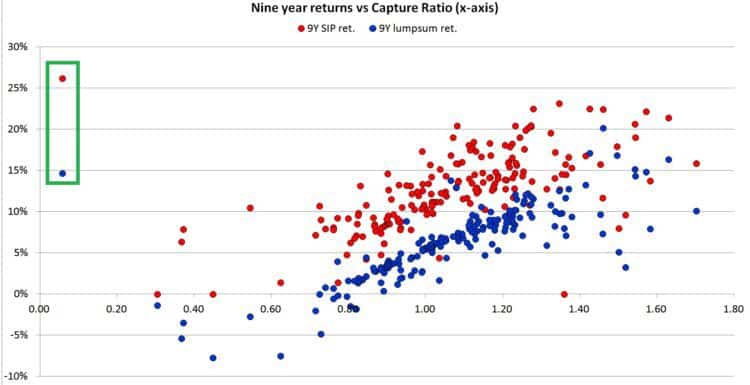
Notice the reasonable correlation between return and capture ratio (Upside/downside) or (managed-reward/managed-risk). The outlier is again DSP Microcap.
Thus the message here is the capture ratio is a good metric to use for mutual fund selection. However, I would prefer to also keep an eye on consistent downside protection too.
Five-Year Returns Vs Upside Capture

In this case, the outlier is again DSP fund!! DSP Top 100 – very poor upside performance. The pattern is the same – poor correlation.
Five-Year Returns Vs Downside Capture
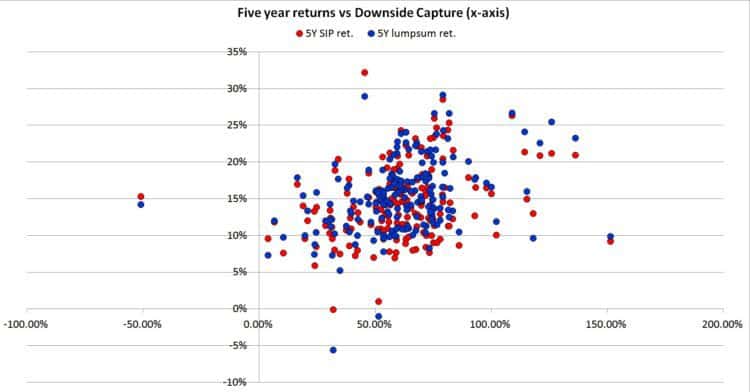
Not much correlation. The outlier is the same. DSP Top 100 but in this case, exceptionally good downside protection!
Would you choose such a fund? Not so hot upside performance but great downside protection?!
Five-Year Returns vs Capture Ratio
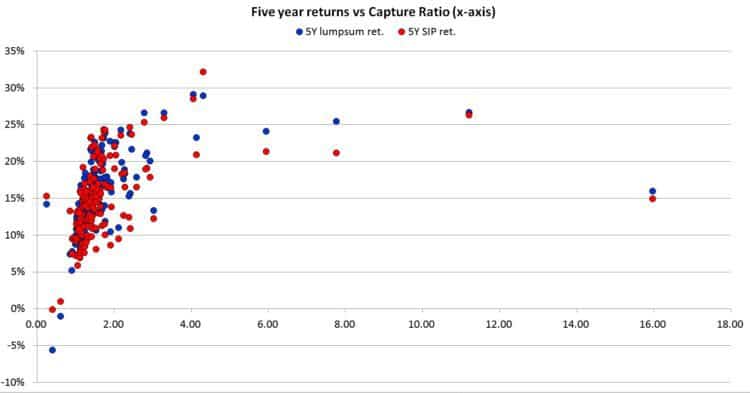
Plenty more outliers here with exceptionally high capture ratios. However, within the main bunch, there is now reasonable correlation.
I am happy to see this correlation between return and capture ratio. As mentioned above, I would prefer a consistent downside protection plus reasonable upside performance. So instead of relying on capture ratio alone, it is important to look at the individual metrics – upside and downside.
If you are interested:
You Can Be Rich Too


My new book with PV Subramanyam, published by CNBC TV 18
The book comes with 9 online calculator modules to create your own financial plan.
It also has detailed selection guides for equity and debt mutual funds.
Amazon (₹ 375/-)
Kindle (₹ 244.30)
Infibeam ₹ 280 with Coupon BS10
Googe Play Books App Store (₹ 244.30)
What Readers Say
A must book for everyone who wants to take control of personal finance. Nice explanation of how a debt mutual fund works. Bonds trading and indexation benefits in high inflation years were something new I learnt. After reading this book you will be able to easily choose any funds, because you will know what that fund does or how that fund works By Amazon Customer on 17 December 2016
You can read all reviews here