Last Updated on January 12, 2023 at 10:07 pm
Use this tool to compare the risk-adjusted year-on-year performance of two mutual funds over the last 8 years. This is an alternative to the previously published, fund A vs. fund B mutual fund analyzer, in which the comparison could be made for investment durations ranging from 1-8 years.
This year-on-year analyzer allows you to compare funds on a risk-adjusted basis over the last year*, year before that, year before that and so on.
*last year wrt to current NAV date.
When should you use this tool?
🔥Secure your future with our Robo-advisory tool trusted by over 3,500 investors and advisors. From effortless retirement planning to funding your children’s biggest dreams, turn your financial goals into reality. 🔥
Subscribe for money management solutions via email! (Link takes you to our email sign-up form) Join 32,000+ readers in our community.
👉 New Tool Alert! NaviPlan: A Privacy-Focused Multi-asset Tracker and Goal Planner 👈
1) Decide on the mutual fund category you are going to invest in
2) Make a short-list (not more 4-5 funds). See this guide for how to do this within a few minutes.
3) You might consider using an additional filter. The above guide offers one way to do this. In the investor workshops, I recommend using Upside and Downside ratios, specifically consistently low downside capture ratios measured wrt to an appropriate benchmark (Morning Star gives you this for many funds). Will write a detailed post on this soon.
4) You can also use the Mutual Fund Risk and Return Analyzer , for more flexibility wrt benchmarks and risk-return metric, plus the ulcer index.
5) Whichever method you choose, if your shortlist is down to 2/3 funds and simply cannot choose between them, the present year-on-year comparison might help settle it for you.
6) There may be situations when you are invested in fund A and there is a buzz about fund B. You can this tool to objectively analyze risk-adjusted performance.
What does the tool offer?
Although the tool computes several metrics, user can prefer to simply use the relative risk-return score. A score of above 50% implies that fund A has done well and a score of less than 50% implies that fund B has done well.
For example, here is a comparison between Franklin India Blue Chip fund (fund A) and ICICI Pru Focussed Blue Chip fund (fund B).
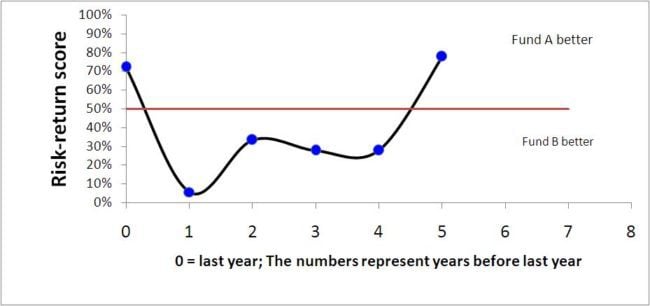
Verdict: In the last few years, ICICI blue chip has comfortably beat Franklin blue chip. Franklin’s fund has appeared to have picked up its game since the start of the bull run.
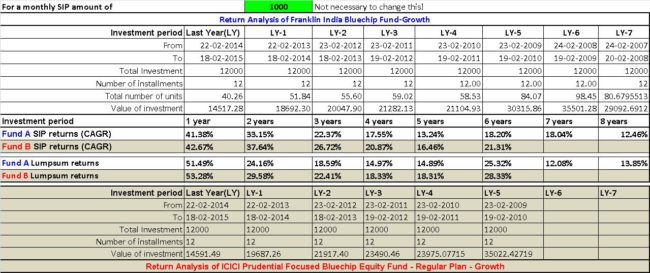
You can also compare year-on-year SIP and lump sum returns (click to enlarge)
You can do an upside/downside capture ratio analysis.
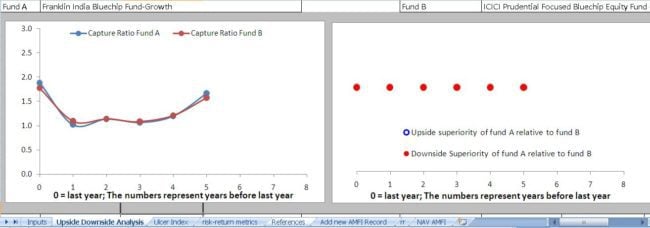
The capture ratio = upside-capture-ratio/downside-capture-ratio.
When measured wrt to a benchmark (not the case here), if this is higher than 1, it means the fund has beat its benchmark.
In this case, the upside and downside capture ratios of fund A relative to that of fund B is measured. In terms of capture ratio, you cannot differentiate the funds but in terms of downside superiority, fund A (Franklin Blue Chip) is superior to fund B (ICICI blue chip).
Verdict: fund B take more risks than fund A, but it seems to have paid off in the recent past (with the exception of last year) with higher returns. So far, the risk appears to be worth it.
Is that enough for you to choose ICIC blue chip over Franklin blue chip? I think many would say, yes 🙂
Personally, I prefer funds with consistent downside protection. Don’t listen to me though. I am drowning in my conservative, pessimistic outlook.
One could argue that the ICICI fund was started after the 2008 crash and could choose stock appropriately, but the same was true of the Franklin fund when it was started after the Harshad Mehta scam and could pick and choose stocks freely when the Sensex was flat for several years.
Does this mean that when the market moves sideways it pays to have a ‘good’ fund with (reasonably) low AUM? hmm …
This tool is now part of the freefincal investor circle. Join the investor circle! Enjoy a 50% discount for a limited time and pay only Rs. 3000 with discount code circle50. You can get lifetime access to several unique tools, discussion forums, and bug fixes.