Last Updated on December 31, 2015 at 9:06 am
Mutual fund downside protection refers to instances when the weekly or monthly or year return of the fund is better than its benchmark, when the benchmarks corresponding return is negative. For example, suppose a fund gives a monthly return of -10%, when the benchmark has given a return of -15%. The fund has only captured 67% (-10%/-15%) of the benchmarks loss. This is known as downside capture and can be used for mutual fund portfolio construction.
The steps associated with mutual fund portfolio construction are quite simple:
- Have a financial goal in mind and decide how much to invest
- Next step: Deciding on asset allocation for a financial goal. How much should be invested in equity, how much in fixed income etc.
- Decide on mutual fund categories: Search categories How to select mutual fund categories suitable for your financial goals?
- Choose a minimalist portfolio corresponding to the above asset allocation.
- Screen mutual funds in each category based on consistent performance (return)
- Have a shortlist and look for consistent downside protection (other metrics are also fine but downside is simplest and does not depend on requirement of a normal distribution). This tool will help in this step.
Here is a tool that allows you to visually analyze the consistency in mutual fund downside protection.
Consistent downside protection is the key to alpha generation.
🔥Secure your future with our Robo-advisory tool trusted by over 3,500 investors and advisors. From effortless retirement planning to funding your children’s biggest dreams, turn your financial goals into reality. 🔥
Subscribe for money management solutions via email! (Link takes you to our email sign-up form) Join 32,000+ readers in our community.
👉 New Tool Alert! NaviPlan: A Privacy-Focused Multi-asset Tracker and Goal Planner 👈
A corresponding definition of upside capture can be easily surmised. A more detailed explanation can be found in this post: Understanding Upside and Downside Capture ratios
Monthly upside and downside captures can be reported in terms of an annualized return (CAGR). This data is available at Morningstar India measured with respect to BSE 100 as explained in this post: Mutual Fund Analysis with Upside and Downside Capture Ratios
Upside and downside captures calculated with respect to multiple benchmarks have been presented earlier: Mutual Fund Downside Protection Calculator. This calculation is also part of a detailed risk versus return analyzer: Version 4.0 – Mutual Fund Risk and Return Analyzer.
Instead of calculating annualized return from monthly downside captures, all such captures are graphically presented in this sheet.
Downside captures above 100% are marked in red. Meaning they are ‘bad’. The fund lost more than its benchmark.
Downside captures less than 100% are marked in green. Meaning they are ‘good’. The fund lost less than its benchmark.
Extreme downside protection: Sometimes the fund would register a positive return when the benchmark fell. The downside capture would then become negative. This is typically rare. Such instances are not shown in the graph since a logarithmic scale is necessary for easy viewing.
Mutual Fund Downside Protection Consistency Analysis
Here are some examples:

That is pretty poor. Perhaps Prashant Jain is struggling to make changes because his fund is too big. Perhaps he is waiting for a ‘proper’ economic turnaround. We cannot say. It is however clear that HDFC equity investors have had a stressful time. That said, the fund has typically soared above the benchmark in a bull run.
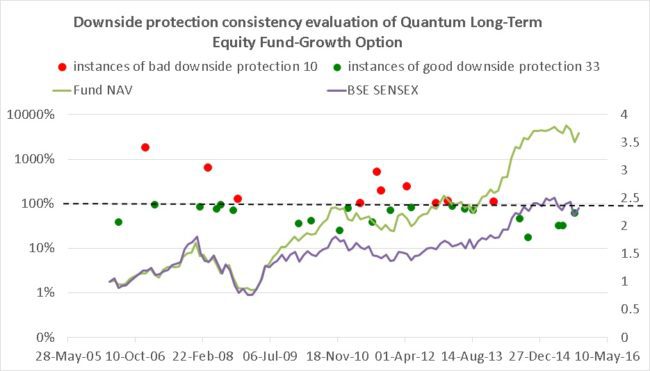
Not exactly a superstar in terms of returns, but is a reliable fund when it comes to downside protection.
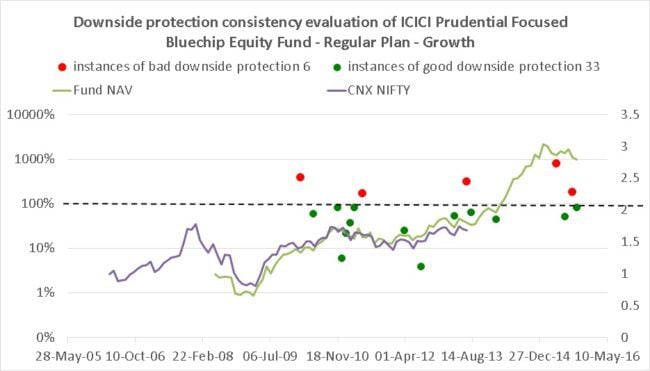
This fund is popular with good reason!
Note: The fund and benchmark movements are normalized from April 2006. If the fund is younger, the normalization would be off as in the above graph.
When you open the downside consistency analysis page, Excel will give you a warning that negative values cannot be plotted in log scale. Click ‘okay’ and ignore it. This is a reference to extreme downside protection data points.
Analyse your fund holdings with this sheet and let me know what you think.