Last Updated on December 18, 2021 at 10:51 pm
A simple way to measure how consistent a mutual fund has been in outperforming a benchmark over a given period, in the form a simple percentage is discussed in this post. Depending on your feedback I will include this in this months mutual fund return listings.
The simplest and most intuitive way to measure outperformance is to use rolling returns.As regular readers may be aware freefincal has rolling return calculators for both lump sum and SIP investments with a choice of 50 benchmark indices for comparison.
The most important advantage with rolling returns is that they are simple to understand. Way more simpler than the greek alphabets – alpha, beta, gamma, Sharpe, Sortino etc. and even simpler than upside and downside capture ratios.
What are rolling returns
Suppose I ask what is the return for the last 3 years for a fund. I am considering the NAV growth between two days. The current NAV and the NAV three years ago. This is known as a point to point calculation. The return value depends on when I choose to make a calculation.
🔥Secure your future with our Robo-advisory tool trusted by over 3,500 investors and advisors. From effortless retirement planning to funding your children’s biggest dreams, turn your financial goals into reality. 🔥
Subscribe for money management solutions via email! (Link takes you to our email sign-up form) Join 32,000+ readers in our community.
👉 New Tool Alert! NaviPlan: A Privacy-Focused Multi-asset Tracker and Goal Planner 👈
Instead, if I have NAV data for the past 10 years and calculate the three return between
1st Jan 2006 to 31st Dec 2008
2nd Jan 2006 to 1st Jan 2009
3rd Jan 2006 to 2nd Jan 2009 and so on for every business day from 1st Jan 2006 to the current day.
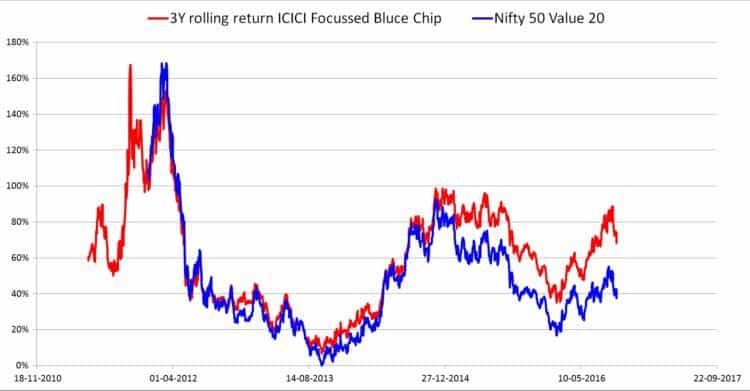
So you can imagine that I will get 100s of 3Y return data points for the fund. Then I repeat the exercise by choosing an appropriate benchmark and compare the two. Here is an example.
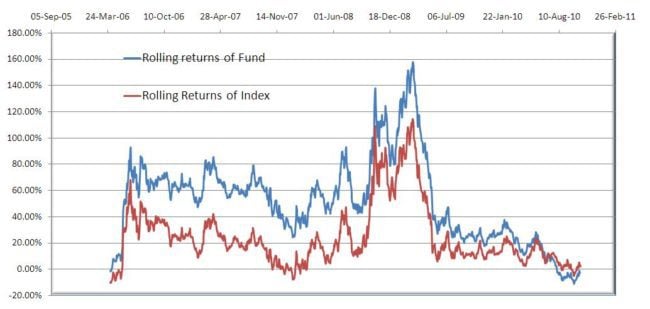
The graph immediately tells you that the fund has been quite regular in beating the chosen benchmark. This gives a easy to understand visual measure of performance consistency.
This can be expressed as a percentage too:
Consistency score = (no of times fund has beat index)/(total no of rolling return entires). Expressed as a percentage.
Higher this score, the more consistent the fund has been in outpeforming the benchmark.
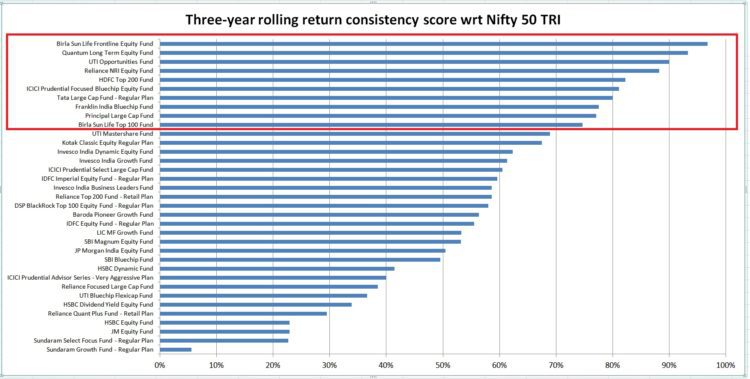
Three-year rolling return consistency score wrt Nifty 50 TRI
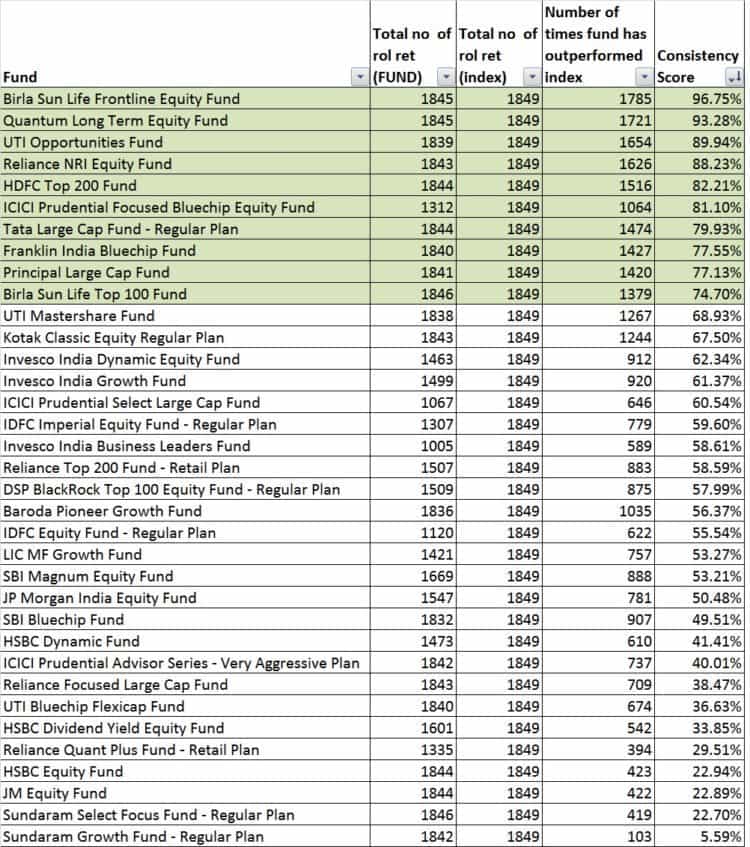
The funds which have a scopre above 70% are highlighted in green. The same data in bar chart form.
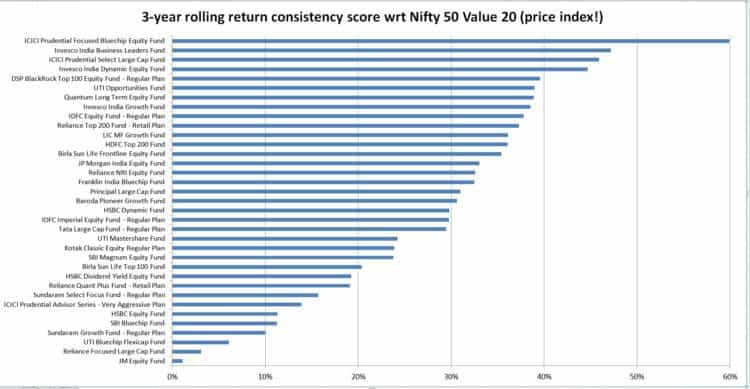
Three-year rolling return consistency score wrt Nifty 50 Value 20
The Nifty 50 Value 20 is a concentrated index of 20 value stocks from the Nifty 50. It is a much more stringent benchmark for evaluating large cap funds. However much of the index data is backtested. So we will have to check real time data for a while to evaluate the suitability of this index.
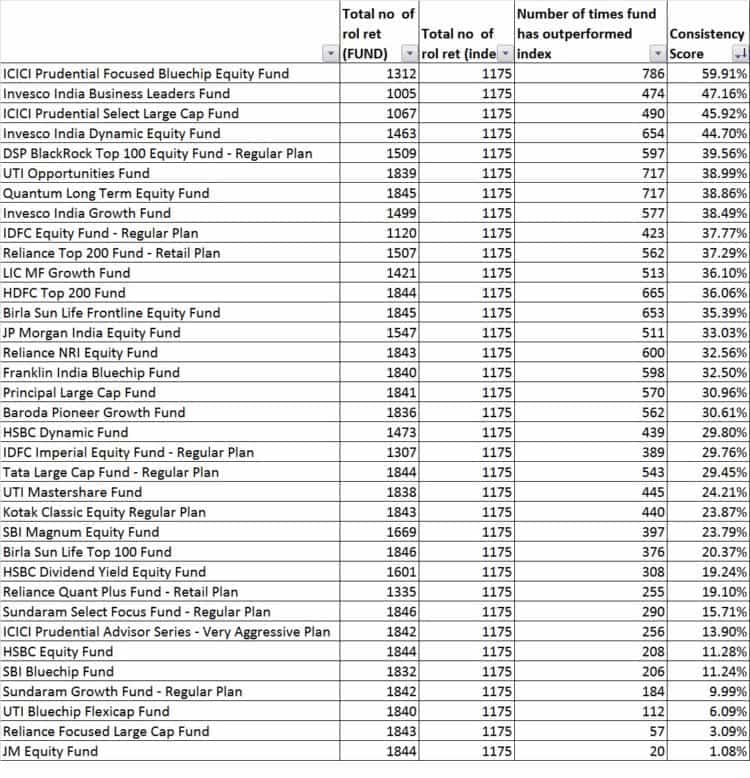
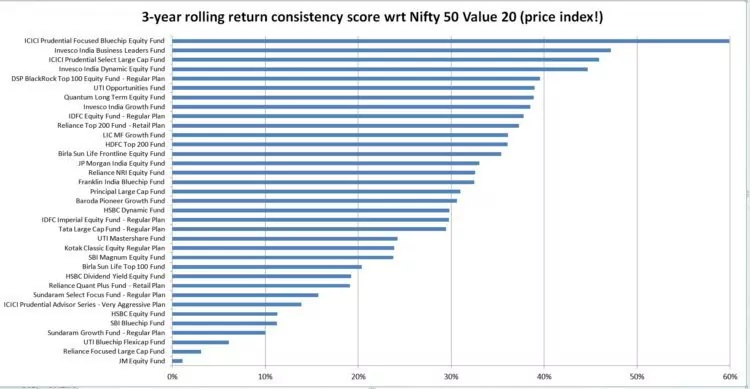
Amusing only ICICI Focussed Blue Chip has a reasonable track record against the Value 20 index.
The consistency score is a simple way to determine outperformance with respect to a chosen benchmark. Do let me know what you think about this.