Last Updated on December 29, 2021 at 5:48 pm
On 14th Oct 2020, the Nifty P/E ratio or PE ratio was 34.87. This was an all-time high from 1st Jan 1999. This means the Nifty 50 was priced at 34.87 times its earnings. The latest PE ratio at the time of publication is 34.37 (23rd Oct 2020). Investors are worried if this high PE is an indicator of a market crash. A discussion on the current state of the market.
Let us start with the Nifty PE from 1st Jan 1999 to Oct 23rd 2020 with 10-year moving average and first and second standard deviation bands. All graphs in this article were created with the Nifty Valuation Tool.
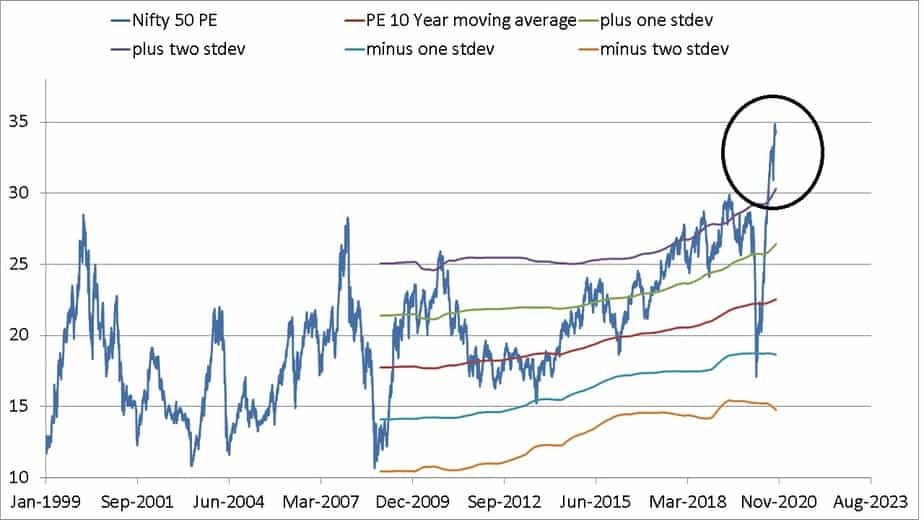
The encircled region points to the all-time high. Nifty PE believers may point out that the “correction” has already begun. However, there are several features in this graph that require careful inspection and assimilation.
- The notion of “all-time high” requires some qualification. During the Harshad Mehta Scam, Sensex PE hit an all-time high (55-60) which has still not been breached. See Market Timing with Index PE Ratio. One of the most intelligent investors this author has come across had said, “during the 2008 crash, the Sensex PE was high but it much lower than what it was in the early 90s. Therefore we did not think that the market would crash”.
- Historical PE values of no consequence with respect to determining the future course of the market.
- A market can crash any time there is a collective lack of faith in future prospects, at a “low PE” or a “high PE”. See: Why Do Stock Markets Crash?
- In Jan 2009, the 10Y PE average was about 17.7. In Oct 2020 it is about 22.3. The average line has continuously moved up in the previous decade. So these formulae that go around about “high PE”, “low PE’, overbought, oversold etc. there are keep changing on a day to day basis.
- In Nov 2010, Nifty PE rose above the average + two standard deviation line (plus-2 band) and fell down. It is quite easy to get swayed by this and assume, “high PE = bad news” if not an outright crash.
- In Jan 2018; Sep 2018 and May 2019 The Nifty PE went above the plus-2 band “corrected” but not by much. In real-time it would simply be impossible to determine what is happening.
- The only firm conclusion that can be made is, “a low PE is a good time to invest”
The Nifty PB from 1st Jan 1999 to Oct 23rd 2020 with 10-year moving average and first and second standard deviation bands is shown below. This paints an entirely different picture.
🔥Secure your future with our Robo-advisory tool trusted by over 3,500 investors and advisors. From effortless retirement planning to funding your children’s biggest dreams, turn your financial goals into reality. 🔥
Subscribe for money management solutions via email! (Link takes you to our email sign-up form) Join 32,000+ readers in our community.
👉 New Tool Alert! NaviPlan: A Privacy-Focused Multi-asset Tracker and Goal Planner 👈
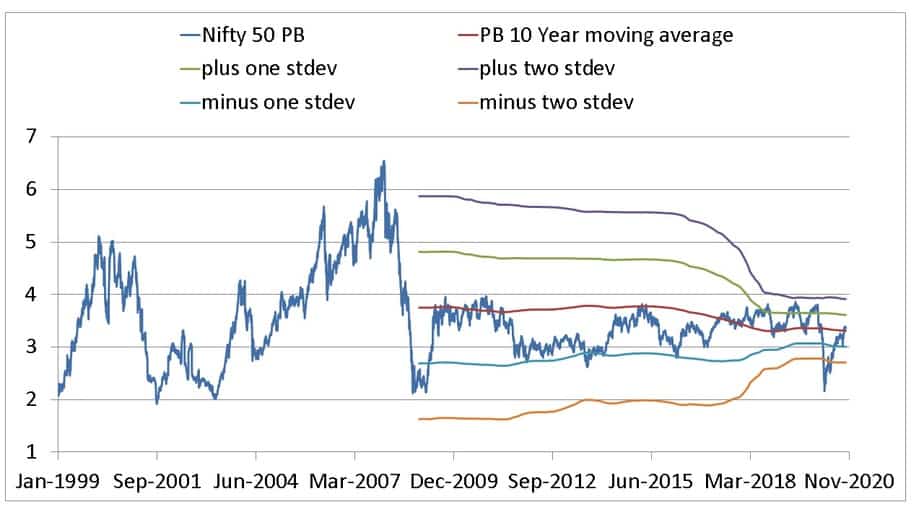
- The notion of a “low PB” has decreased with time.
- What looked like an overvalued market in the PE graph looks like a fairly priced market in the PB graph.
- Looking at the more sedate movement of the PB, it seems likely that ICICI MFs equity valuation index (published each month in their factsheet) weights PB more than PE. This is also known from the investment strategies used for ICICI Balanced Advantage and Multi-asset funds. Also see: Is PB-based investing better than PE-based investing?
Will the market crash because Nifty PE is at an all-time high?
If you appreciate honesty, we do not know; we cannot know. How about trying to time the market with Nifty PE? if you appreciate opinions that originate only from data, see Market Timing with Index PE Ratio: Tactical Asset Allocation Backtest. If you prefer to follow “commonsense” and “intuition” then good luck with trying to slip between raindrops without getting wet.
Market timing with the PE ratio does work but not the way we want! It is an efficient way to lower risk more often than not. Whether this effort results in more returns is pretty much potluck. See: Want to time the market with Nifty PE? Learn from Franklin Dynamic PE Fund. NB: Franklin has now included PB in its strategy. This study predates that.
As readers may be aware, different types of market timing strategies have been backtested and among these the one that has worked more often than not (higher returns) is based on the momentum of the six months moving average relative to the twelve-month moving average. See: This “buy high, sell low” market timing strategy surprisingly works!
In summary, a high PE does not mean much. If you wish to use the Nifty PE for market timing, you should expect lower risk and not higher returns. New investors are always assuming if they buy during dips, they can get more returns. Sorry, it does not work that way: Want to time the market? Then do it right! Buying on dips is not timing!
We do not know which way the market is heading in the future, however, I am certain about one thing: waiting for the market to fall is the worst mistake an investor can do. Whether or not you choose to time the market, systematic investment is essential. Those who deploy a tactical strategy quietly act on it; own up to it; They do not go around “discussing” it in personal finance forums.