Last Updated on August 22, 2022 at 11:26 pm
The Nifty Total Market Index consists of 750 stocks covering large, mid, small and microcap segments with stock weights determined by free-float market capitalization. The NSE launched this index in Oct 2021 with a backtested history up to April 2005. This article compares the rolling returns of the Nifty Total Market Index and Nifty 50 to appreciate which is better and if there is anything special about a “total market index”.
Just as the Nifty 100 consists of Nifty 50 and NIfty Next 50, the Nifty Total Market Index consists of Nifty 500 and Nifty Microcap 250 index. The top ten stocks of the total market index are listed below with their weights in percentage. The number within brackets represent the weights in the NIfty 50. Source: Index factsheet
For example, The total maker index has 6.98% of Reliance while the Nifty 50 has 10.7%.
- Reliance Industries Ltd. 6.98 (10.7)
- HDFC Bank Ltd. 5.89 (9.03)
- Infosys Ltd. 5.26 (8.07)
- ICICI Bank Ltd. 4.73 (7.25)
- Housing Development Finance Corporation 4.37 (6.70)
- Tata Consultancy Services Ltd. 2.99 (4.59)
- Kotak Mahindra Bank Ltd. 2.54 (3.89)
- Hindustan Unilever Ltd. 1.82 (2.79)
- Larsen & Toubro Ltd. 1.82 (2.78)
- Bajaj Finance Ltd. 1.67 (2.56)
Will adding 700 more stock (using their market cap for weights) maker a difference to the returns?
🔥Secure your future with our Robo-advisory tool trusted by over 3,500 investors and advisors. From effortless retirement planning to funding your children’s biggest dreams, turn your financial goals into reality. 🔥
Subscribe for money management solutions via email! (Link takes you to our email sign-up form) Join 32,000+ readers in our community.
👉 New Tool Alert! NaviPlan: A Privacy-Focused Multi-asset Tracker and Goal Planner 👈
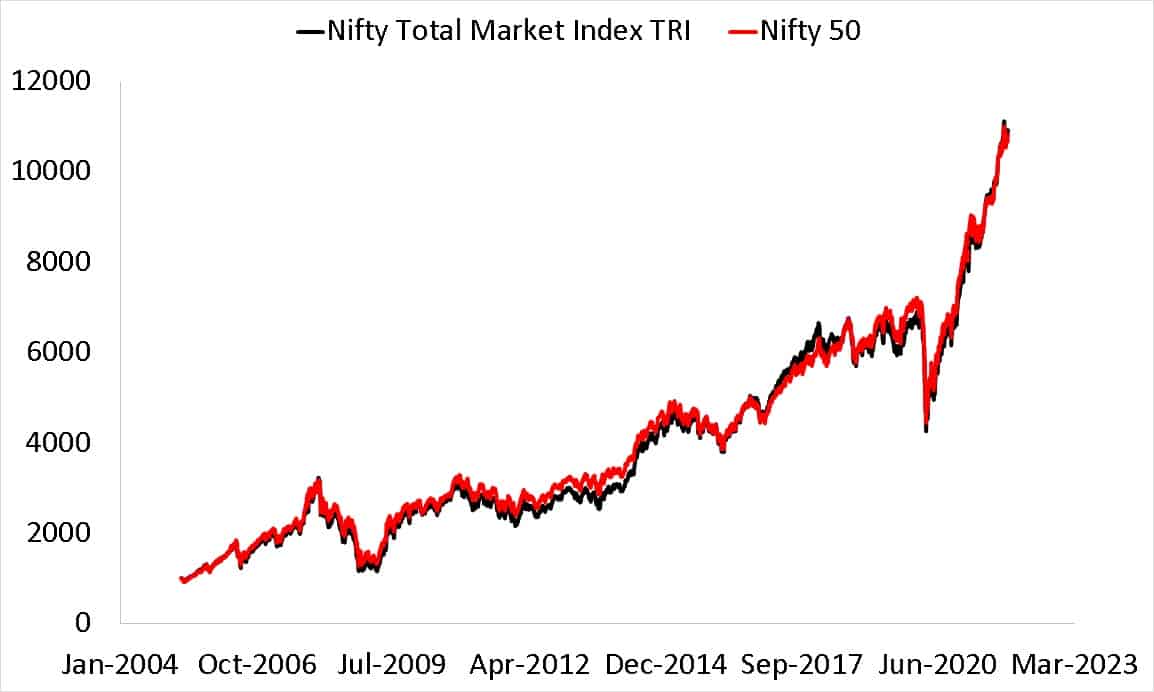
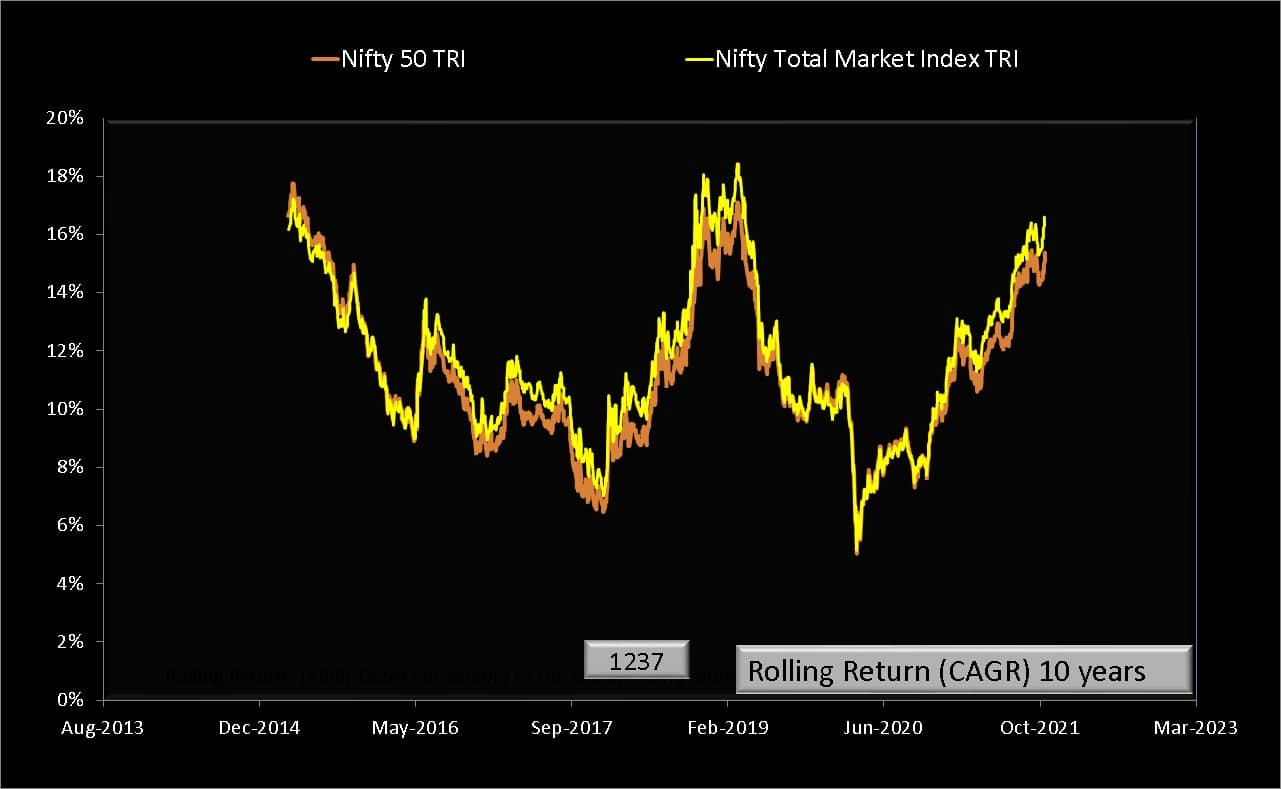
No, it does not! This is the 10-year rolling returns comparison.
We can also add NIfty 500 TRI into the mix.
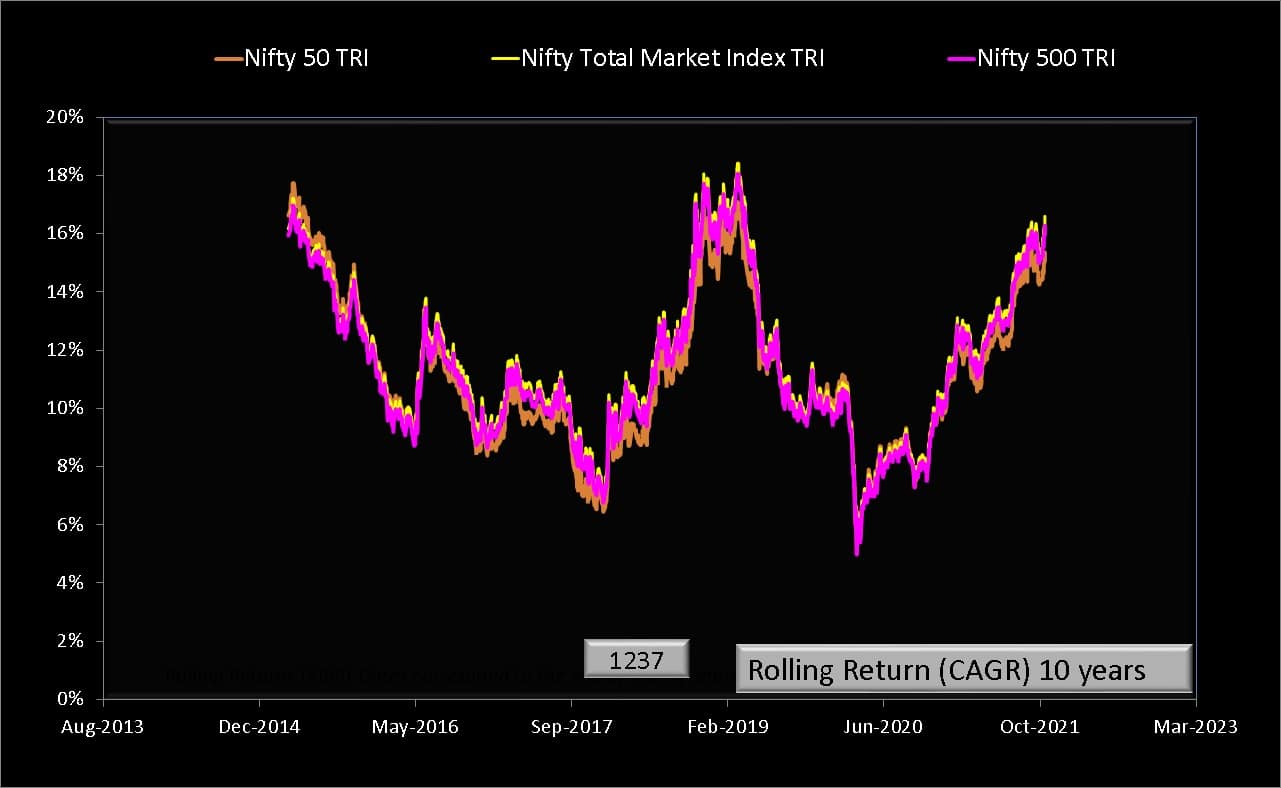
How is this possible? How can 700 more stocks not make any difference to the returns? This is because of the market capitalization based weighting. Since the market cap of the top few stocks in the NSE is much greater than the rest, the contribution from the remaining stocks will typically be minuscule.
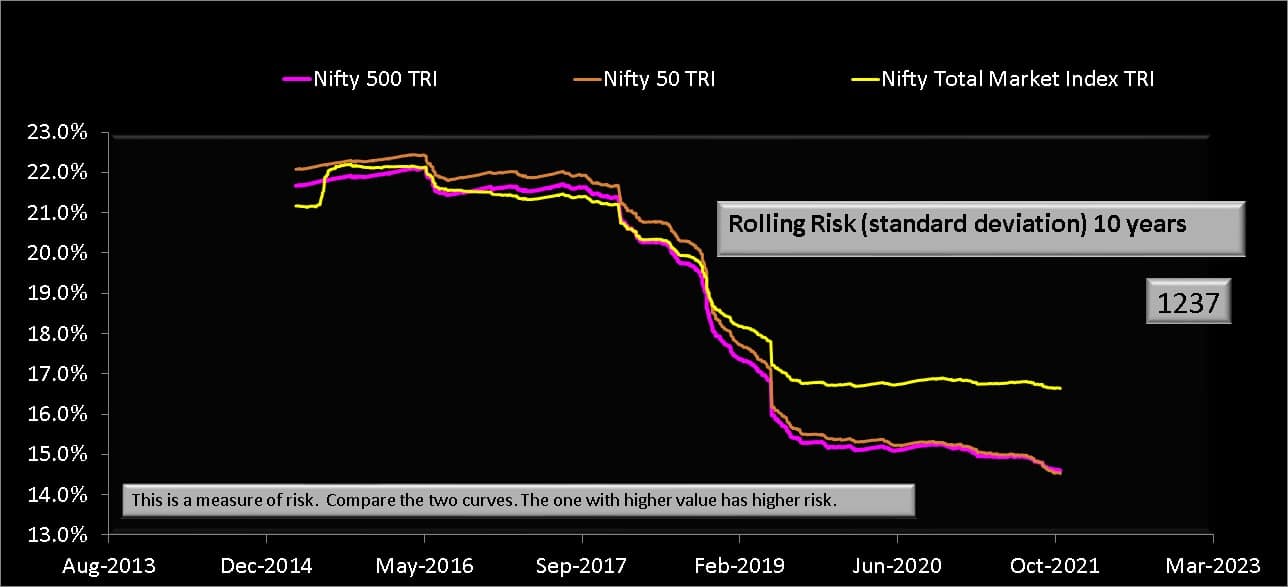
The 10-year rolling standard deviation (volatility) is shown below. There is again not much difference between the three indices.
As we have shown earlier – Not all index funds are the same! Beyond top 100 stocks tracking errors are huge! – it would be extremely difficult for a fund manager to manage 750 stocks.
There is not much difference between the Total Market index and Nifty 50 returns before tracking error. Considering management fees and tracking error (demand-supply price variations aka impact cost and AUM in and outflows), it is a no-brainer that the simple Nifty or Sensex index fund is a far superior choice compared to any passive option tracking the Nifty Total Market Index. The extra stocks do not result in any benefit for the investor.