Last Updated on December 29, 2021 at 5:44 pm
The NSE has introduced a new strategy index, Nifty200 Momentum 30 index which tracks the performance of 30 stocks with high momentum score. We evaluate the performance of the index in this article.
What is momentum investing? Invest in stocks that have moved up considerably over the past 6-12 months hoping that the trend will continue into the future (for a short period). Relevant data and links for the Indian and US markets are discussed here: Momentum Stock Investing in India: Does it work?.
The BSE already has its own momentum index which has been reviewed earlier: Watch my talk on momentum and low volatility stock investing in India (also see above link). Regular readers may also be aware of our momentum and low volatility stock screener that is published monthly. This allows the user to screen for stocks based on the trailing one-year volatility, beta, six-month and 12-month momentum. A monthly historical archive of the screener is also available.
🔥Secure your future with our Robo-advisory tool trusted by over 3,500 investors and advisors. From effortless retirement planning to funding your children’s biggest dreams, turn your financial goals into reality. 🔥
Subscribe for money management solutions via email! (Link takes you to our email sign-up form) Join 32,000+ readers in our community.
👉 New Tool Alert! NaviPlan: A Privacy-Focused Multi-asset Tracker and Goal Planner 👈
Before we begin, investors should appreciate that momentum investing is a high-risk, high-churn investing strategy. Please do not attempt to replicate index behaviour privately without understanding what it entails. As a new index, its entire history is based on backtested data. Also, a ‘thank you’ to Ashutosh on Twitter for pointing me to this index.
Nifty200 Momentum 30 Index Construction: To be eligible for shortlisting the stock should be (1) part of the Nifty 200 (top 200 stocks by market cap traded in the NSE), (2) listing history of at least one year, (3) available for trading in the derivatives segment. If a stock moves out of the Nifty 200, it will also leave the momentum index at the time of review.
Each stock will have a maximum weight limit of 5% which will be done at the time of semi-annual rebalancing (June and December). There shall also be a quarterly compliance review. The weight is determined using the formula: free-float market cap x Normalised Momentum Score. The index will consist of 30 stocks with the highest normalised momentum score.
The normalised momentum score is based on a combination of 6-month and 12-month momentum. First, a momentum ratio is defined as return divided by the standard deviation. So a 6-month momentum ratio is a six-month return divided by the standard deviation of daily returns over the last year and a 12-month momentum ratio is 12-month return divided by the standard deviation of daily returns over the last year. Reference: NSE index methodology document
The six-month momentum and 12-month momentum Z-scores are defined relative to the average 6,12-month momentum ratio and standard deviation of these ratios among all eligible stocks. This essentially means selecting stocks well above the average momentum score. A Z-score pf +3 represents a performance that is three standard deviations above average. The final momentum Z-score or the Weighted Average Z Score is 50% of 6-month Z-score plus 50% of 12-month Z-score.
For positive Weighted Average Z Score, the normalised momentum score is defined as 1+ Weighted Average Z Score and negative Weighted Average Z Score, the normalised momentum score is defined as 1/(1-Weighted Average Z Score). This is done to several penalize negative Z-scores. A schematic is shown below.
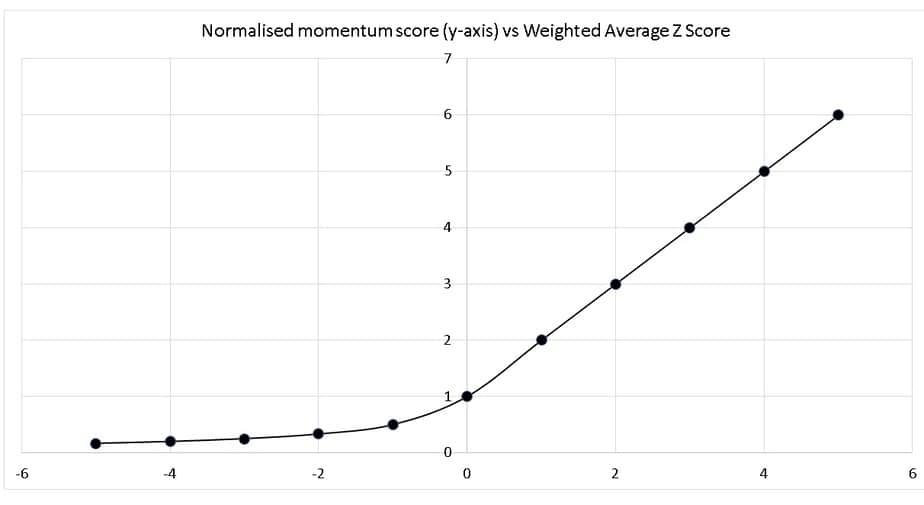
The top 30 stocks with the highest Normalized Momentum Score are selected for inclusion in the Nifty200 Momentum 30 Index.
Nifty200 Momentum 30 Index Performance
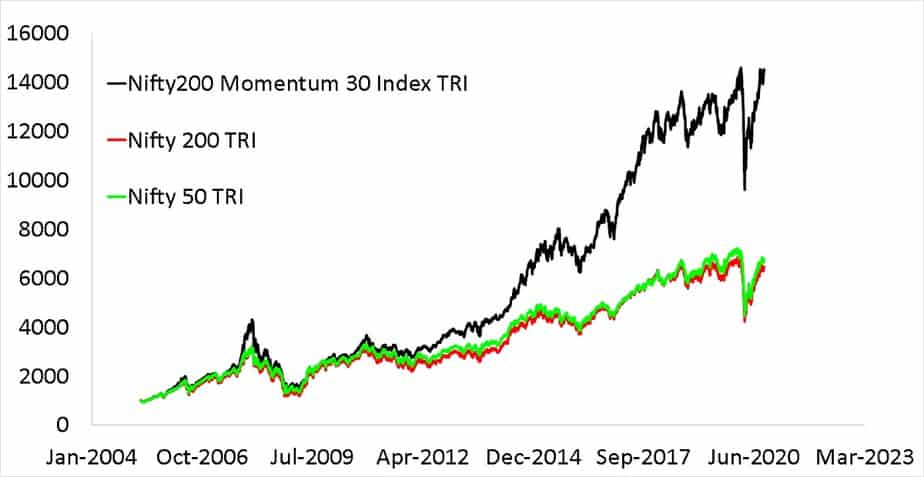
This is the since inception movement of Nifty200 Momentum 30 Index TRI along with Nifty 200 TRI and Nifty 50 TRI. It is important not to get mislead by such graphs as this represents a single return. Rolling returns (see below) can paint a very different picture.
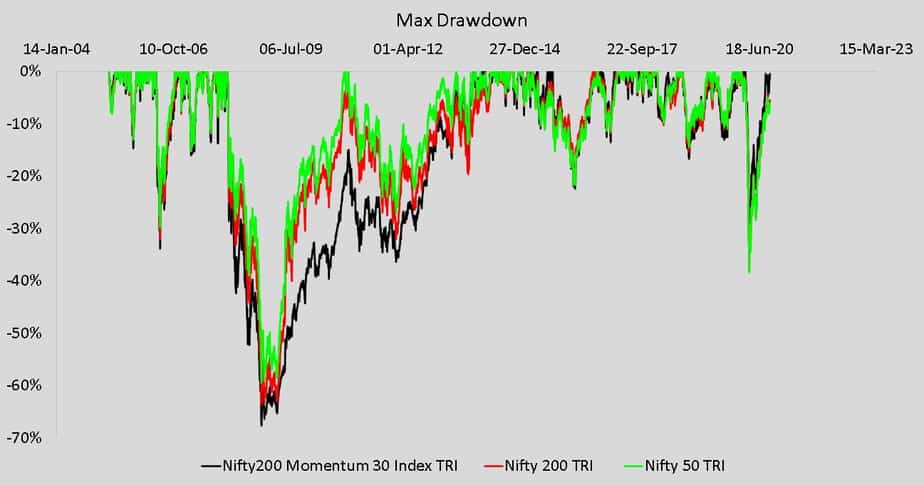
The maximum drawdown (max fall from all-time high) of Nifty200 Momentum 30 Index TRI along with Nifty 200 TRI and Nifty 50 TRI is shown below. During bearish phases, the momentum index investor would suffer more losses.
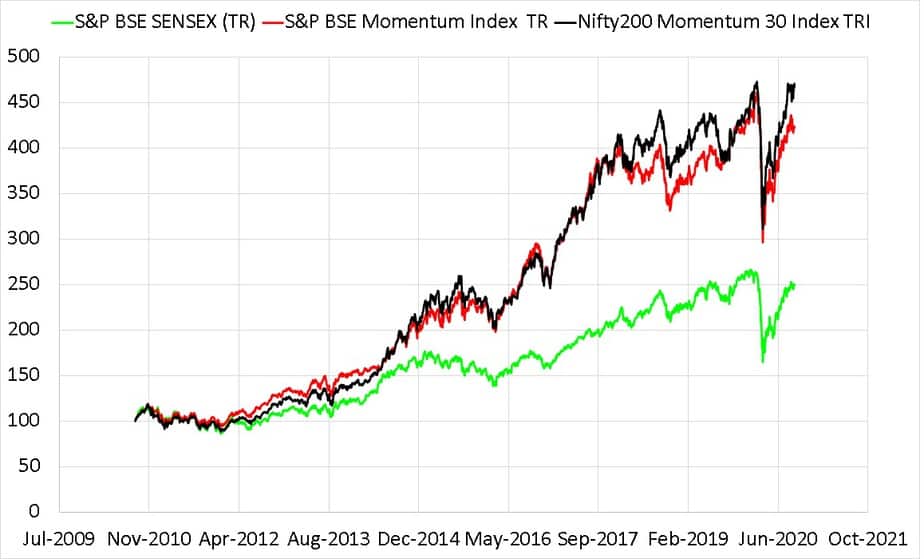
Next, this is a comparison of Nifty200 Momentum 30 Index TRI along with BSE Sensex TRI and BSE Momentum Index TRI. The BSE momentum index has 30 stocks with the highest momentum score from BSE Largecap index. There is not much difference between the two momentum indices.
We compare 2601 five-year rolling returns below. When the bull phase beings, the momentum index outperforms the base index.
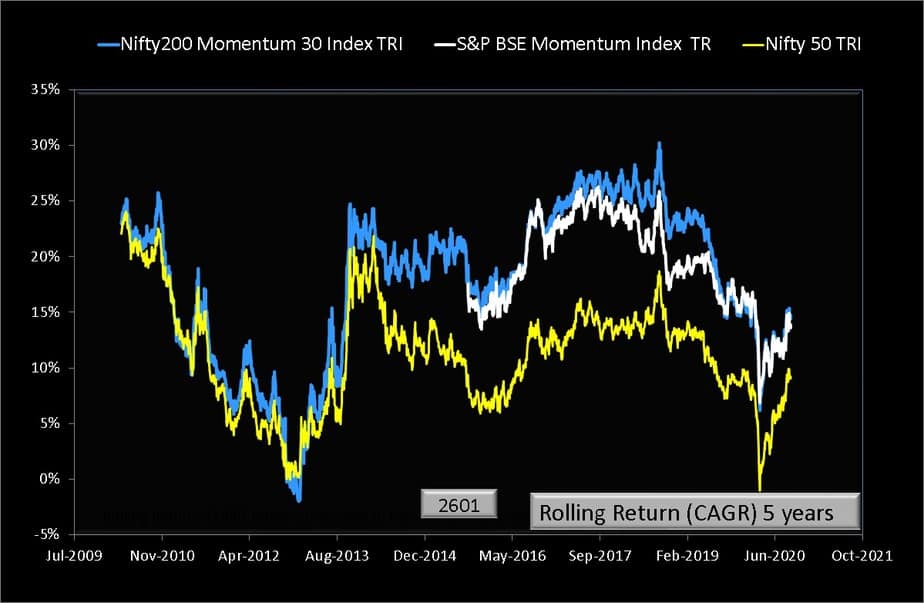
Rolling standard deviation (volatility) data is presented below. The momentum index has higher volatility as expected, however, the difference with respect to Nifty 50 is not surprisingly not significant.

In summary, Nifty200 Momentum 30 Index is a long-expected interesting offering from the NSE. Perhaps AMCs might consider launching an ETF based on this index. They are unlikely to launch index funds as they can profit more with active thematic funds (SEBI rules permit an unlimited number of passive funds and thematic funds).
Update: UTI has filed a new offer document with SEBI for a momentum index fund based on this very index!
DIY replication of the momentum index will require robot-like discipline. Also the tax outgo and brokerage could be significant. So kindly tread with ample caution and due diligence. It might interest the reader to note that SBI Dynamic Asset Allocation Fund adopts a momentum strategy in part.