Last Updated on December 18, 2021 at 10:38 pm
With an aim to encourage readers to analyse and evaluate mutual fund performance on their own, using my excel files when possible ;), I would like to post the analysis of a fund from time to time.
In the past, I have covered HDFC Top 200 twice:
and have covered Franklin India Blue Chip several times
- Daily vs. Monthly vs. Quarterly SIP
- Rolling returns analysis
- Mutual Fund risk and return measures
This time I would like to discuss Reliance Growth.
Join 32,000+ readers and get free money management solutions delivered to your inbox! Subscribe to get posts via email! (Link takes you to our email sign-up form)

🔥Want to create a complete financial plan? Learn goal-based investing? Exclusive access to our DIY tools? Increase your income with your skills? Use this link to enjoy massive discounts on our robo-advisory tool & courses! 🔥
Reliance Growth is, according to Value Research, a ‘multi-cap’ fund, presently with about 44% mid- and small-cap exposure out of its 95% equity exposure.
It is well known that Reliance Growth was the darling of investors not too long ago. It has an AUM of 4205 Crores. It is also well known that its performance has dipped in the recent past.
Here is how your investment would have evolved had you started a SIP on April 3rd 2006.
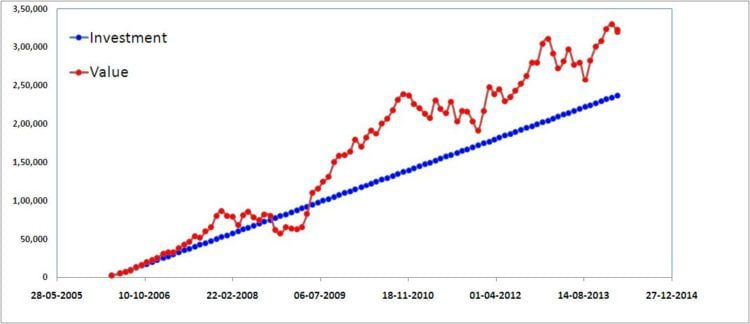
A CAGR of 7.75%. Not spectacular for a period of 7.9 years, but not terrible either(?!) This plot was generated with the automated mutual fund and financial goal tracker in development. If you would like to test it out, a beta version is available.
The aim of this analysis is not to pan the fund manager (too much!) or to criticise investors who continue to show faith it. The aim is to reiterate simple (enough) analysis techniques that can any investor (with inclination) can use to evaluate a fund performance. This post has been on the agenda for quite a while and got precipitated after a discussion thread in Asan Ideas for Wealth, FB group.
While this will not be an exhaustive analysis using risk and return metrics, I think it will be good enough for most investors to evaluate how consistent a fund is performing when evaluated with its benchmark.
A quick primer on rolling returns:
- Suppose I want to determine fund performance from 1st Jan 2000 to 31st Dec. 2012, I choose some interval. Let say this is one year.
- I calculate the return for the fund and its benchmark from 1st Jan. 2000 to 31st Dec. 2000.Then from 2nd Jan. 2000 to 1st Jan. 2001.
- Then from 3rd Jan. 2000 to 2nd Jan 2001 and so on until I reach 31st Dec. 2012.
- This ‘rolling’ return is then plotted against the duration used.
- If the funds rolling returns is higher than the benchmarks most part of the graph, you can conclude that the fund has been consistent in its outperformance.
- Rolling returns give you an idea about consistency of funds performance with respect to its benchmark.
A more detailed explanation can be found here.
Now for the analysis
- First we use the Automated Mutual Fund SIP Returns Analyzer, select fund, select an index (Choose among: BSE Sensex, CNX Nifty, CNX Midcap, CNX 500 and BSE Bankex), select SIP or lump sum investment dates (after 3rd April 2006) and analyze returns.
Observe Results:
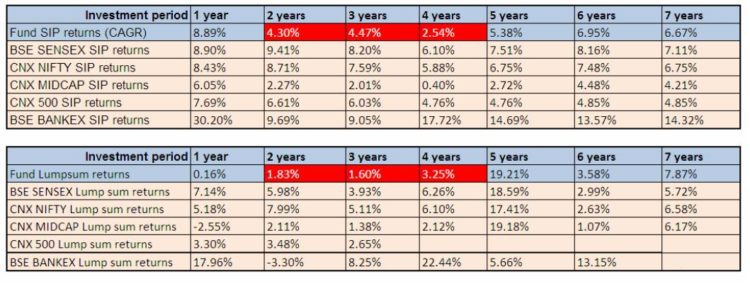
- Bad news: performance for the last 4+ years has …. to say the very least, not been good. Reliance Growth is benchmarked with the BSE 100. Since there is almost 100% correlation between the movements of BSE 100 and BSE Sensex, the latter is a good enough ‘alternative’ benchmark
- Bad news: The recent poor run has affect ‘long’ term (5- 7 years) investors too
- Good news (?): There seems to be some improvement in the performance of SIP investments.
- I will soon be adding more benchmarks and update the format of this tool. The above figure is a collated view where I have added the index figures. The tool only displays only index figures. Since the tool is optimised for SIP returns, certain lump sum dates don’t seem to return results (blanks). I will try to fix this.
- To get a better idea about how consistent the fund has performed with respect to the Sensex we will use the Automated Mutual Fund Rolling Returns Calculator
This allows the user to evaluate rolling returns automatically from 3rd April 2006 onwards.
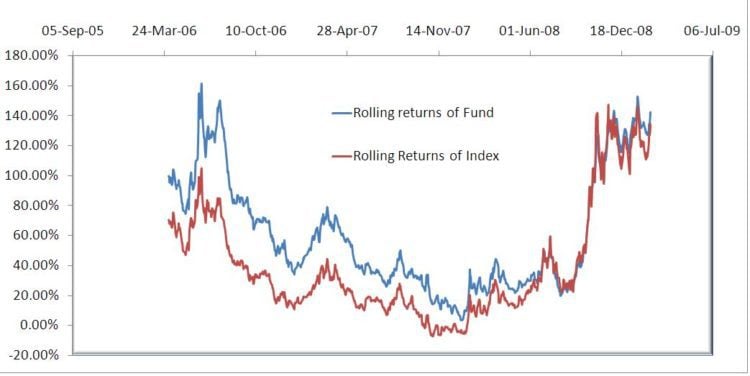
Here is the normalized plots of the fund wrt Sensex.
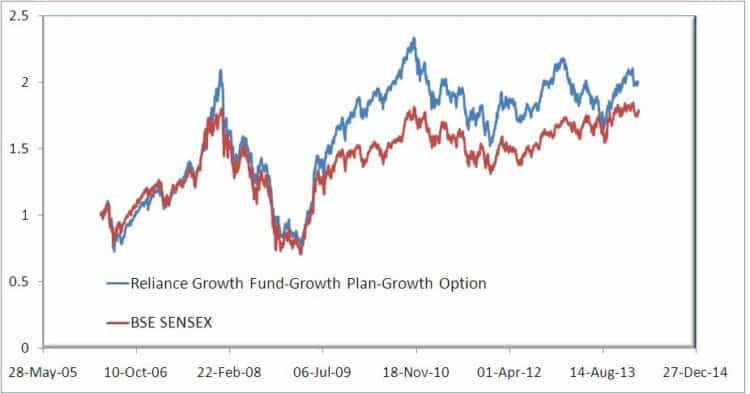
Notice that the fund has struggled to sustain momentum. While it recovered admirably from the 2008 crash, it fell back on the index late last year. Although it has since recovered, it is important to recognise that it is gaining lost ground.
Notice how the fund outperformed the Sensex just before the 2008 crash. This is typical of most equity funds. This reminds us of the importance of proper asset allocation depending on the time frame of investment. Too much equity can destroy a folio under such circumstances.
The one-year rolling return
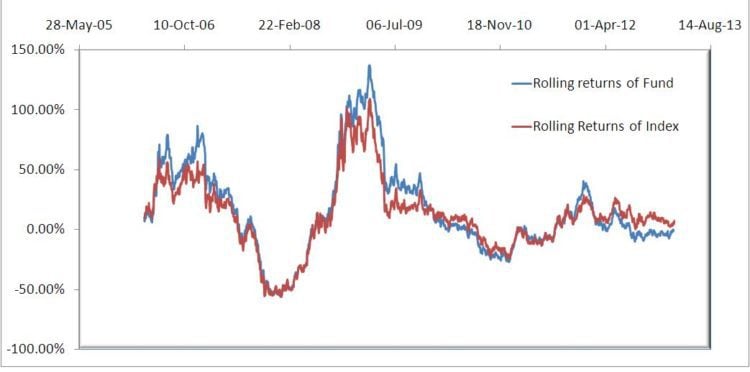
These are point to point returns obtained using the compound interest formula. The numbers would more sedate if XIRR is used. This data is also available in the rolling returns calculator.
Notice that over 1-year periods the fund has performed like an index fund. Nothing abnormal about this. HDFC Top 200 and Franklin India Blue Chip are no different.
Now let us look at 5-year rolling returns.
Notice that the fund has behaved like an index fund since June 2008. This is simply not good enough for an ‘active’ fund, in my opinion, and stinks of a muddled approach. Why should I pay a hefty expense ratio (2.23% for the ‘regular’ fund) for a fund to perform like an index?
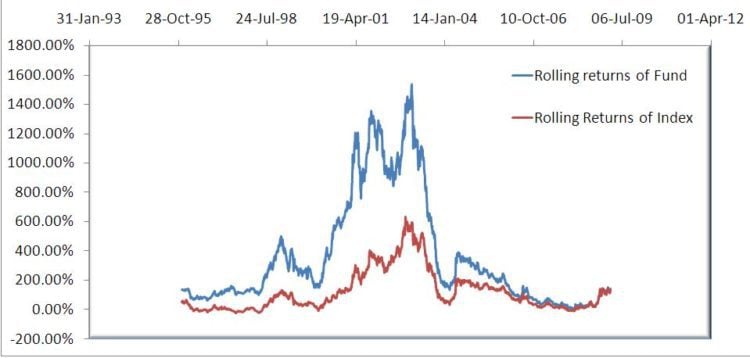
- Reliance Growth has been around for nearly 20 years has an excellent track record, until recently that is. Have a look
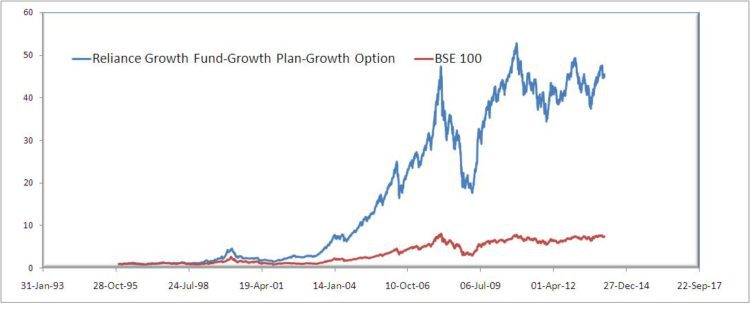
I have used since inception NAV obtained from the AMC along with BSE 100 data obtained from the BSE website.
Spectacular, wouldn’t you say?! Sight for sore eyes. Here are the 15-year rolling returns.
Please ignore absolute values. The trend is accurate. Again, quite astonishing outperformance. However, notice the gradual decline.
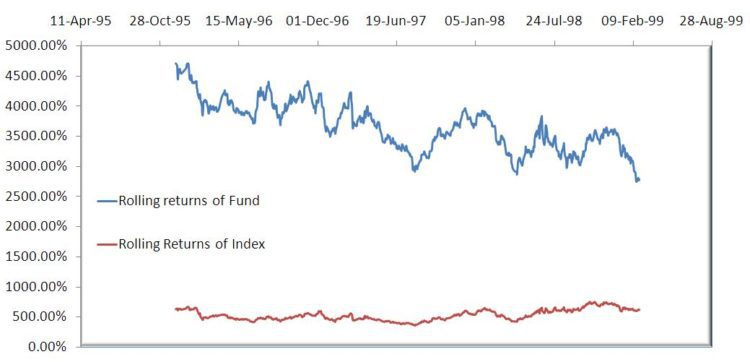
In order to understand the reason for this long term outpeformance, one should plot the 1-year rolling returns since inception.
Notice the terrific run the fund had frominception till about mid of 2005. Since then the fund has behaved as an index fund!!
The huge gap between the fund and its index that we see today stems from gains made when the fund outperformed its index from inception to mid of 2005.
Investors from the early 2000s would still be sitting on good gains. More recent investors would probably be ruing their choice and considering their options.
Again, this is nothing special. Franklin India Blue Chip also has a similar history.
However, the long term rolling returns (5-year plus) of FIBCF or HDFC Top 200 does not merge with its benchmark for such extended periods as Reliance Growth has done – nearly a decade!
The more the I see such trends in active funds, the more I am convinced that passive or index investing is the norm and ‘alpha’ is either a random occurrence which you are lucky enough to be part of or cannot be sustained for long.
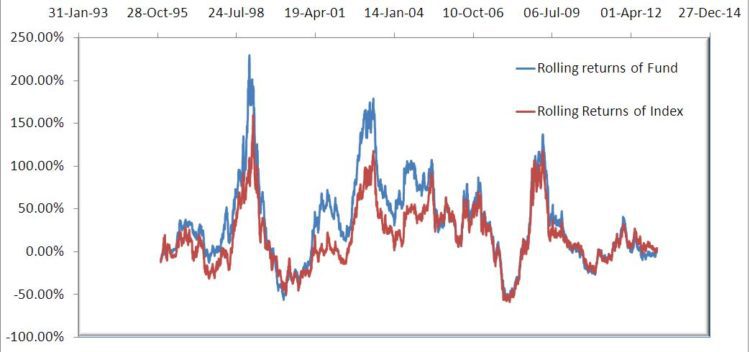
Have a look at the 5-year rolling returns since inception
 The drop in performance is stark and quite dramatic. What is worse is that the standard deviation of these rolling returns is 3 times more volatile than BSE 100! (get more insights from the ‘analysis’ sheet). This suggests thatrisk that Reliance Growth takes is typically not proportional to the reward that it offers.
This is indeed troubling. If I were an investor (I am not), I would exit to greener pastures. Perhaps the fund performance would improve. Perhaps it would once again prove to be the darling of investors.
Exit or stay put, either way it is a risk.
Surely exiting to an index fund or passive fund based on CNX 500 (or a combination of Nifty and Nifty Junior) would involve lower risk than staying put in a fund that seems listless! Would you agree?
Download the Reliance Growth vs. BSE 100 Rolling Returns Calculator
Do give the tools described here a try. You are sure to learn something new and surprising. Believe me, for I did and continue to do so.

Use our Robo-advisory Tool to create a complete financial plan! ⇐More than 3,000 investors and advisors use this! Use the discount code: robo25 for a 20% discount. Plan your retirement (early, normal, before, and after), as well as non-recurring financial goals (such as child education) and recurring financial goals (like holidays and appliance purchases). The tool would help anyone aged 18 to 80 plan for their retirement, as well as six other non-recurring financial goals and four recurring financial goals, with a detailed cash flow summary.
🔥You can also avail massive discounts on our courses and the freefincal investor circle! 🔥& join our community of 8000+ users!
Track your mutual funds and stock investments with this Google Sheet!
We also publish monthly equity mutual funds, debt and hybrid mutual funds, index funds, and ETF screeners, as well as momentum and low-volatility stock screeners.
You can follow our articles on Google News

We have over 1,000 videos on YouTube!

Join our WhatsApp Channel


- Do you have a comment about the above article? Reach out to us on Twitter: @freefincal or @pattufreefincal
- Have a question? Subscribe to our newsletter using the form below.
- Hit 'reply' to any email from us! We do not offer personalised investment advice. We can write a detailed article without mentioning your name if you have a generic question.
Join 32,000+ readers and get free money management solutions delivered to your inbox! Subscribe to get posts via email! (Link takes you to our email sign-up form)
About The Author
 Dr M. Pattabiraman (PhD) is the founder, managing editor and primary author of freefincal. He is an associate professor at the Indian Institute of Technology, Madras. He has over 13 years of experience publishing news analysis, research and financial product development. Connect with him via Twitter(X), LinkedIn, or YouTube. Pattabiraman has co-authored three print books: (1) You can be rich too with goal-based investing (CNBC TV18) for DIY investors. (2) Gamechanger for young earners. (3) Chinchu Gets a Superpower! for kids. He has also written seven other free e-books on various money management topics. He is a patron and co-founder of “Fee-only India,” an organisation promoting unbiased, commission-free, AUM-independent investment advice.
Our flagship course! Learn to manage your portfolio like a pro to achieve your goals regardless of market conditions! ⇐ More than 3,500 investors and advisors are part of our exclusive community! Get clarity on how to plan for your goals and achieve the necessary corpus no matter the market condition!! Watch the first lecture for free! One-time payment! No recurring fees! Life-long access to videos! Reduce fear, uncertainty and doubt while investing! Learn how to plan for your goals before and after retirement with confidence.
Increase your income by getting people to pay for your skills! ⇐ More than 800 salaried employees, entrepreneurs and financial advisors are part of our exclusive community! Learn how to get people to pay for your skills! Whether you are a professional or small business owner seeking more clients through online visibility, or a salaried individual looking for a side income or passive income, we will show you how to achieve this by showcasing your skills and building a community that trusts and pays you. (watch 1st lecture for free). One-time payment! No recurring fees! Life-long access to videos!
Our book for kids: “Chinchu Gets a Superpower!” is now available!


Must-read book even for adults! This is something that every parent should teach their kids right from their young age. The importance of money management and decision making based on their wants and needs. Very nicely written in simple terms. - Arun.Buy the book: Chinchu gets a superpower for your child!
How to profit from content writing: Our new ebook is for those interested in getting a side income via content writing. It is available at a 50% discount for Rs. 500 only!
Do you want to check if the market is overvalued or undervalued? Use our market valuation tool (it will work with any index!), or get the Tactical Buy/Sell timing tool!
We publish monthly mutual fund screeners and momentum, low-volatility stock screeners.
About freefincal & its content policy. Freefincal is a News Media organisation dedicated to providing original analysis, reports, reviews and insights on mutual funds, stocks, investing, retirement and personal finance developments. We do so without conflict of interest and bias. Follow us on Google News. Freefincal serves more than three million readers a year (5 million page views) with articles based only on factual information and detailed analysis by its authors. All statements made will be verified with credible and knowledgeable sources before publication. Freefincal does not publish paid articles, promotions, PR, satire or opinions without data. All opinions will be inferences backed by verifiable, reproducible evidence/data. Contact Information: To get in touch, please use our contact form. (Sponsored posts or paid collaborations will not be entertained.)
Connect with us on social media
- Twitter @freefincal
- Subscribe to our YouTube Videos
- Posts feed via Feedburner.
Our publications
You Can Be Rich Too with Goal-Based Investing
 Published by CNBC TV18, this book is designed to help you ask the right questions and find the correct answers. Additionally, it comes with nine online calculators, allowing you to create custom solutions tailored to your lifestyle. Get it now.
Gamechanger: Forget Startups, Join Corporate & Still Live the Rich Life You Want
 This book is designed for young earners to get their basics right from the start! It will also help you travel to exotic places at a low cost! Get it or gift it to a young earner.
Your Ultimate Guide to Travel
 This is an in-depth exploration of vacation planning, including finding affordable flights, budget accommodations, and practical travel tips. It also examines the benefits of travelling slowly, both financially and psychologically, with links to relevant web pages and guidance at every step. Get the PDF for Rs 300 (instant download)