Last Updated on December 28, 2021 at 6:35 pm
In the third part on the series on tactical asset allocation techniques based on market timing, we evaluate the Market PE and Ten-month moving average methods over five-year vs ten-year periods and also change the equity allocation in the portfolio from 30% to 50% to 70%. In addition, we also use the method followed by Franklin Dynamic PE fund of funds. This time we also use Franklin India Blue Chip Fund for the Equity component and
Warning and Disclaimer
The following is to be treated as investment research based on past data unrepresentative of practical implementation and is not investment advice. They do not factor in behavioural/emotional aspects associated with investing. If you do not know how to understand a backtest result, evaluate its disadvantages, then please, please DO NOT play with your money using market timing. Please watch this video before proceeding further.
What is meant by tactical asset allocation (TAA)?
Asset allocation is the ratio of much equity, fixed income, gold, cash etc. is present in a portfolio. We will only consider equity and fixed income in this study. Tactical asset allocation (TAA) refers to changing these allocations based on certain factors or indicators.
What is market timing?
It is a technique to reduce portfolio risk and/or enhance portfolio returns by changing asset allocation based on our reading of where the market will head in the near future. This can be the stock market, bond market, gold market etc.
🔥Secure your future with our Robo-advisory tool trusted by over 3,500 investors and advisors. From effortless retirement planning to funding your children’s biggest dreams, turn your financial goals into reality. 🔥
Subscribe for money management solutions via email! (Link takes you to our email sign-up form) Join 32,000+ readers in our community.
👉 New Tool Alert! NaviPlan: A Privacy-Focused Multi-asset Tracker and Goal Planner 👈
Is tactical asset allocation necessary?
Yes, as the risk associated with a portfolio must be systematically reduced or contained to ensure we have enough money for our future needs.
Is market timing necessary?
No. Tactical asset allocation is necessary and one need not resort to market timing to do this. TAA is possible based on a target corpus associated with a financial goal. See:
Part 1 How to reduce risk in an investment portfolio
Part 2 Do we need to time the market?
Part 3 Why we need to gradually pull out of equity investments well before we need the money!
Can we time the market?
Yes. However, realistic and reproducible market timing methods have often primarily reduced risk with or without return enhancement. See results here: Want to time the market with Nifty PE? Learn from Franklin Dynamic PE Fund and here: Is it possible to time the market?
Rules of Market Timing with Index PE Ratio
Please refer to: Market Timing with Index PE Ratio: Tactical Asset Allocation Backtest Part 1
Rules of Market Timing with Ten-month Moving average
We will compare two portfolios over a 5-year and 10-year investment period.
1: systematic investing into a portfolio of
(a) 30% equity and 70% fixed income -> 30:70 (over 5Y only)
(c) 50% equity and 50% fixed income -> 50:50 (5Y,10Y)
(a) 70% equity and 30% fixed income -> 70:50 (5Y,10Y)
Equity here refers to Franklin India Blue Chip Fund
Debt here refers to Franklin India Dynamic Accrual Fund.
A total amount of Rs. 1000 will be invested into the portfolio in the above-mentioned asset allocation. The portfolio will be rebalanced once a year. To account for exit loads and tax associated with this, the final portfolio amount will be reduced by 4%.
2: Tactical investing with the rules detailed in parts 1 and 2. The final tactical portfolio is reduced by 20% (this is 5 times the amount assumed for the systematic portfolio as the average no of trades in 10Y is about 5). This 20% accounts for exit loads of equity and fixed income and tax associated with equity. Remember equity was taxed like a debt fund before 2004 and will be again taxed from the current FY.
1 PE-Timing: 5-years and 50% Equity and 50% debt
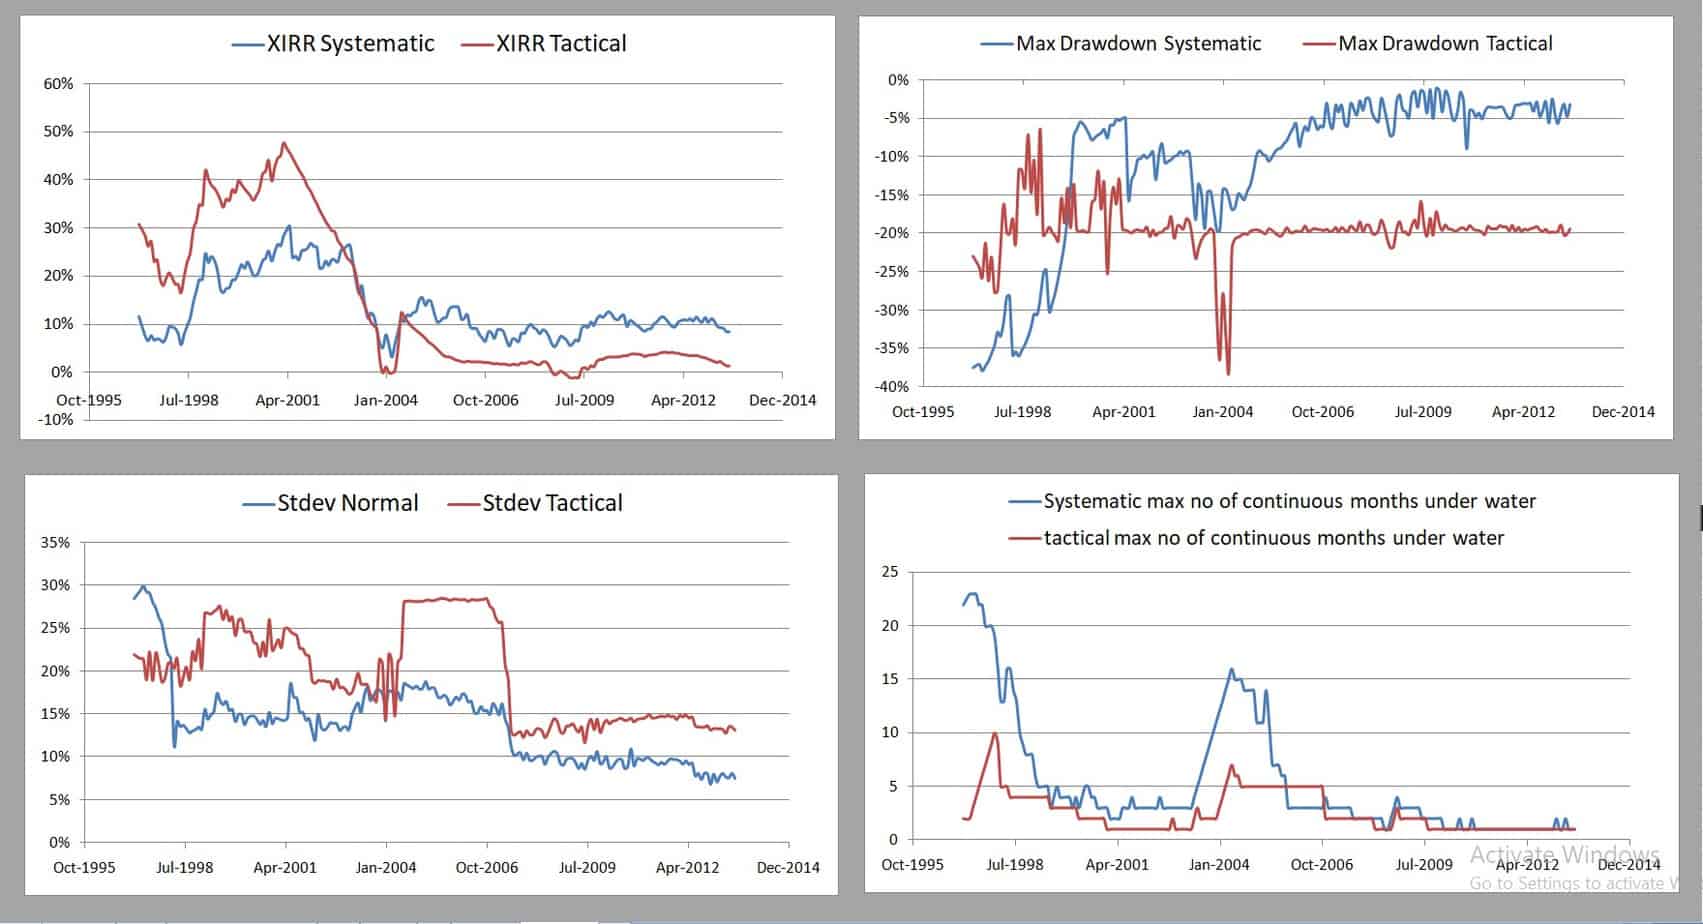
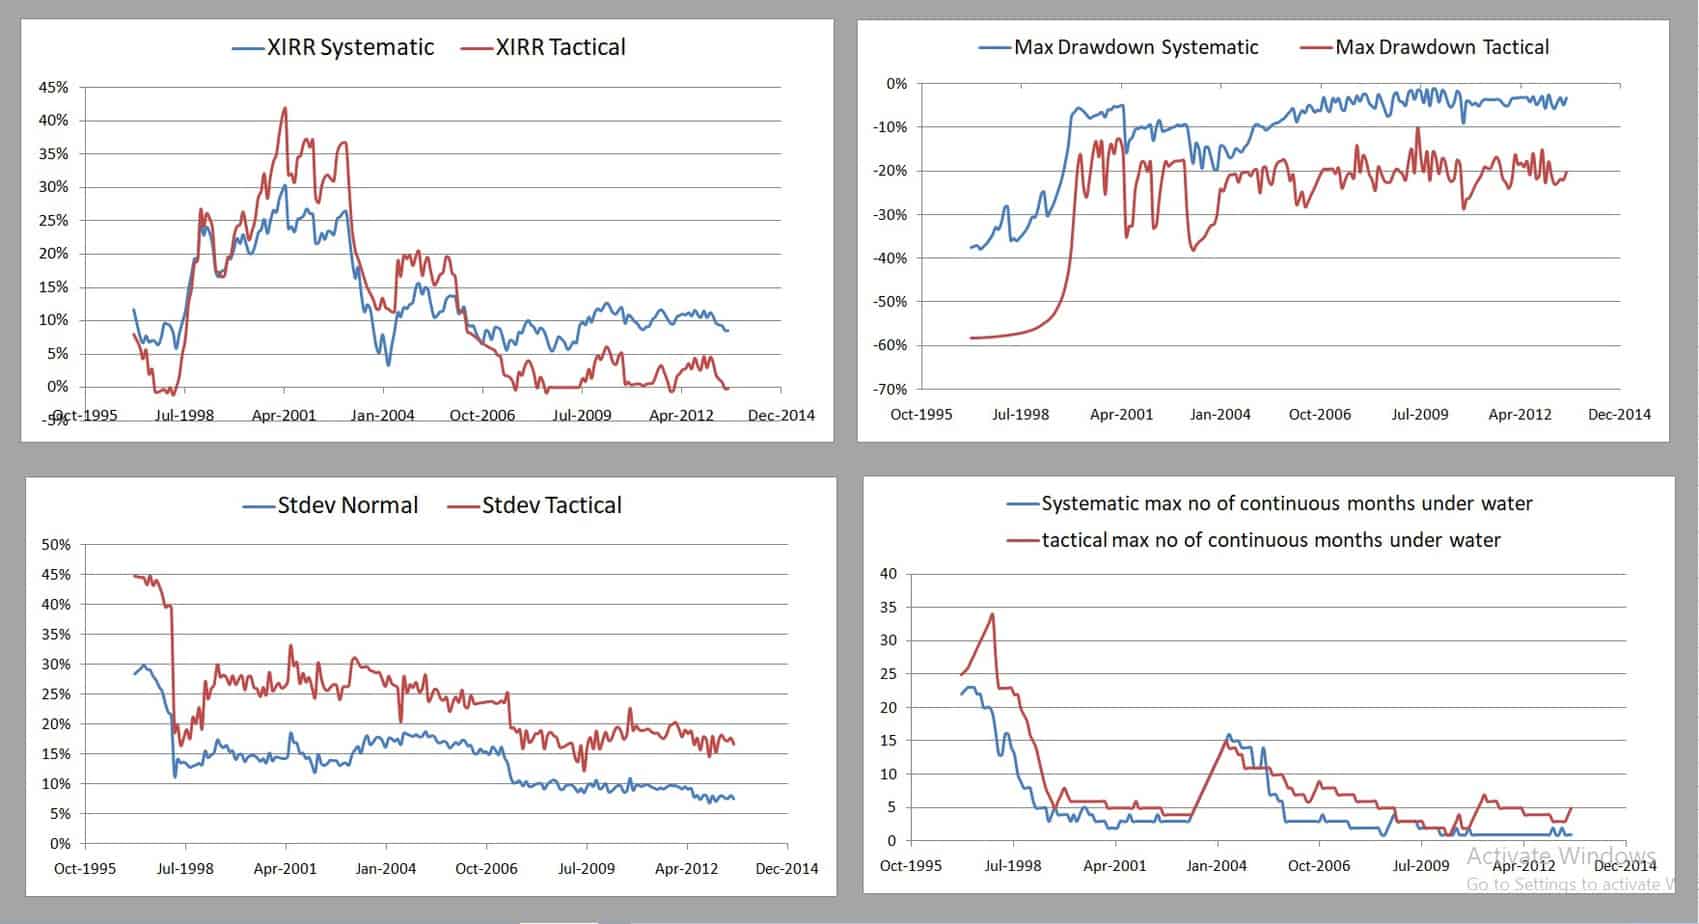
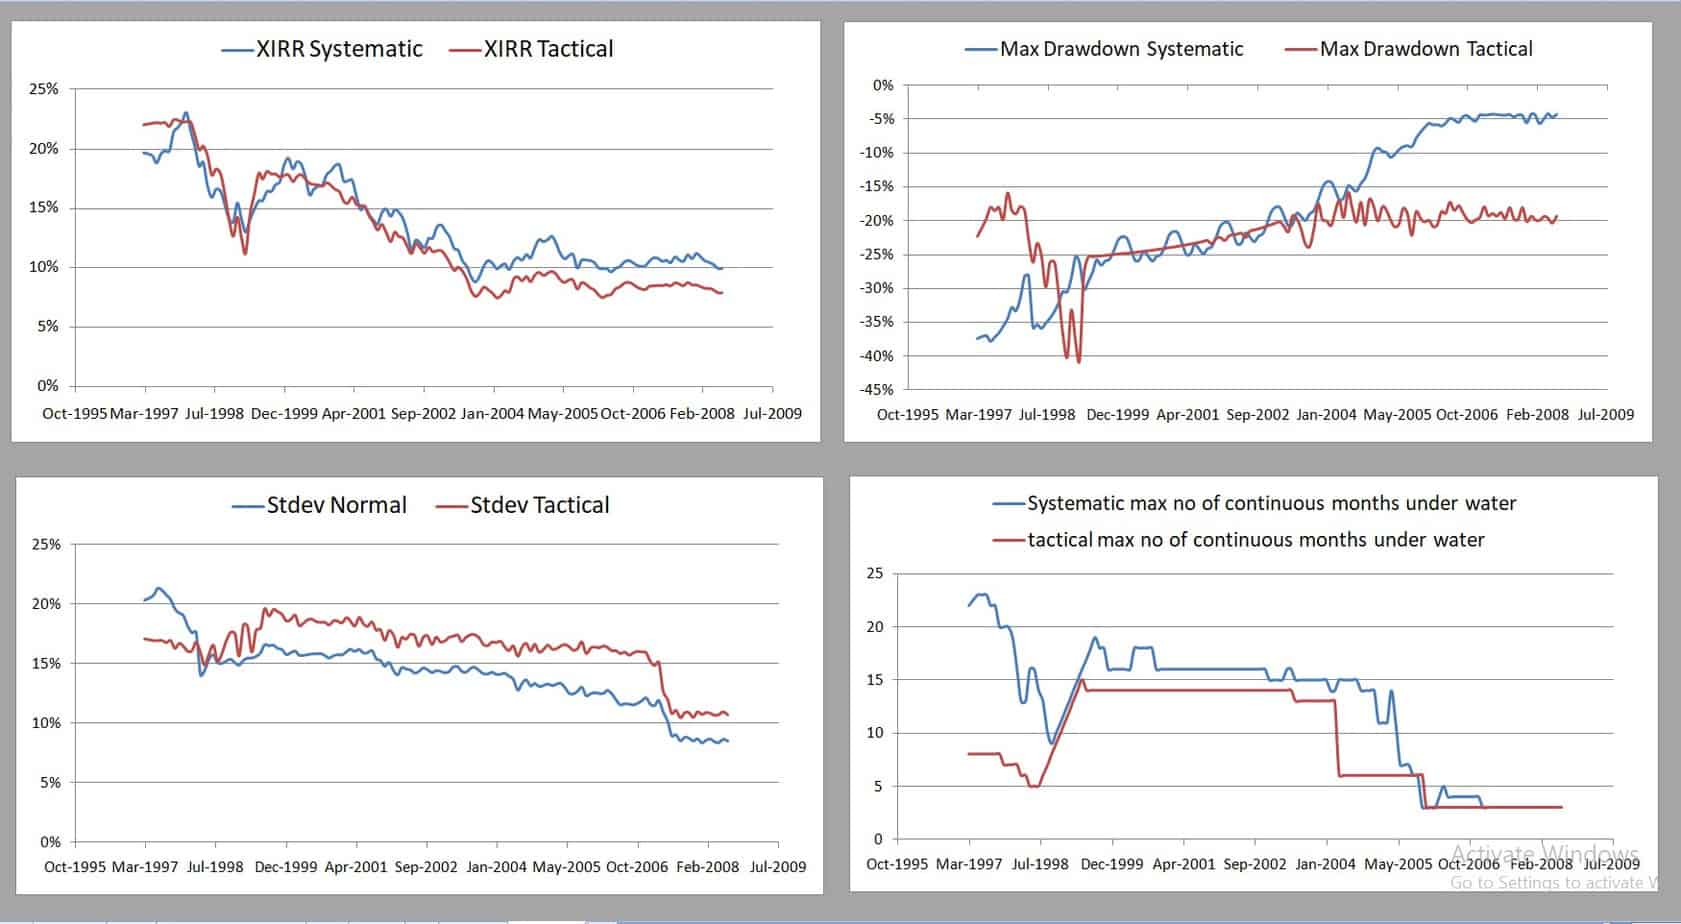
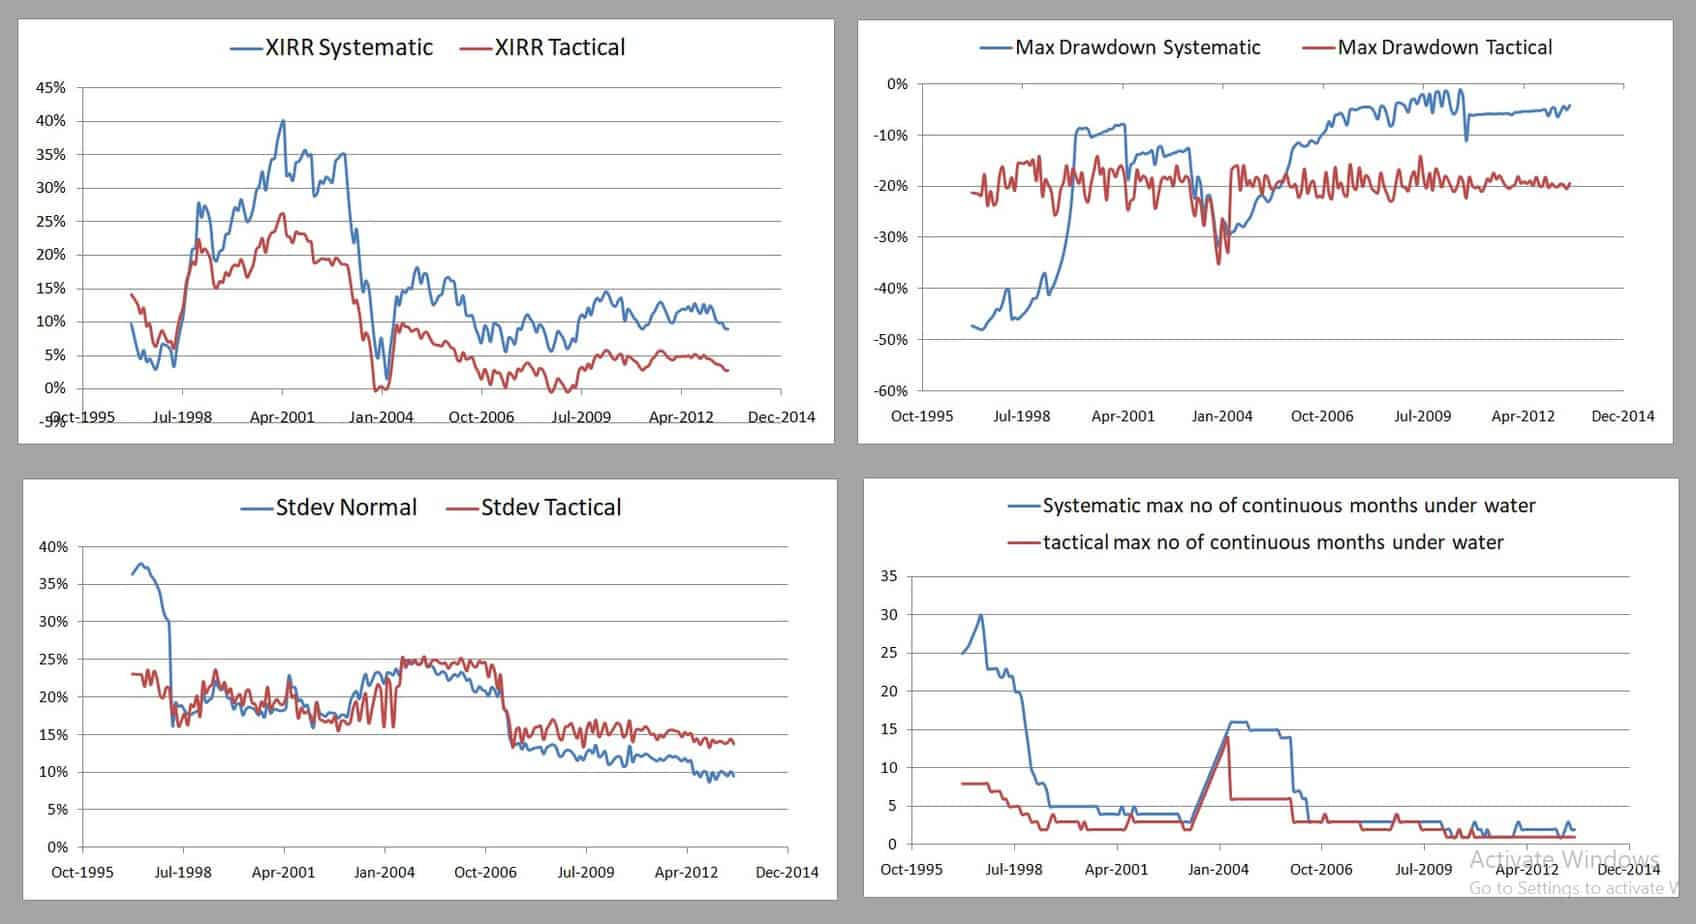
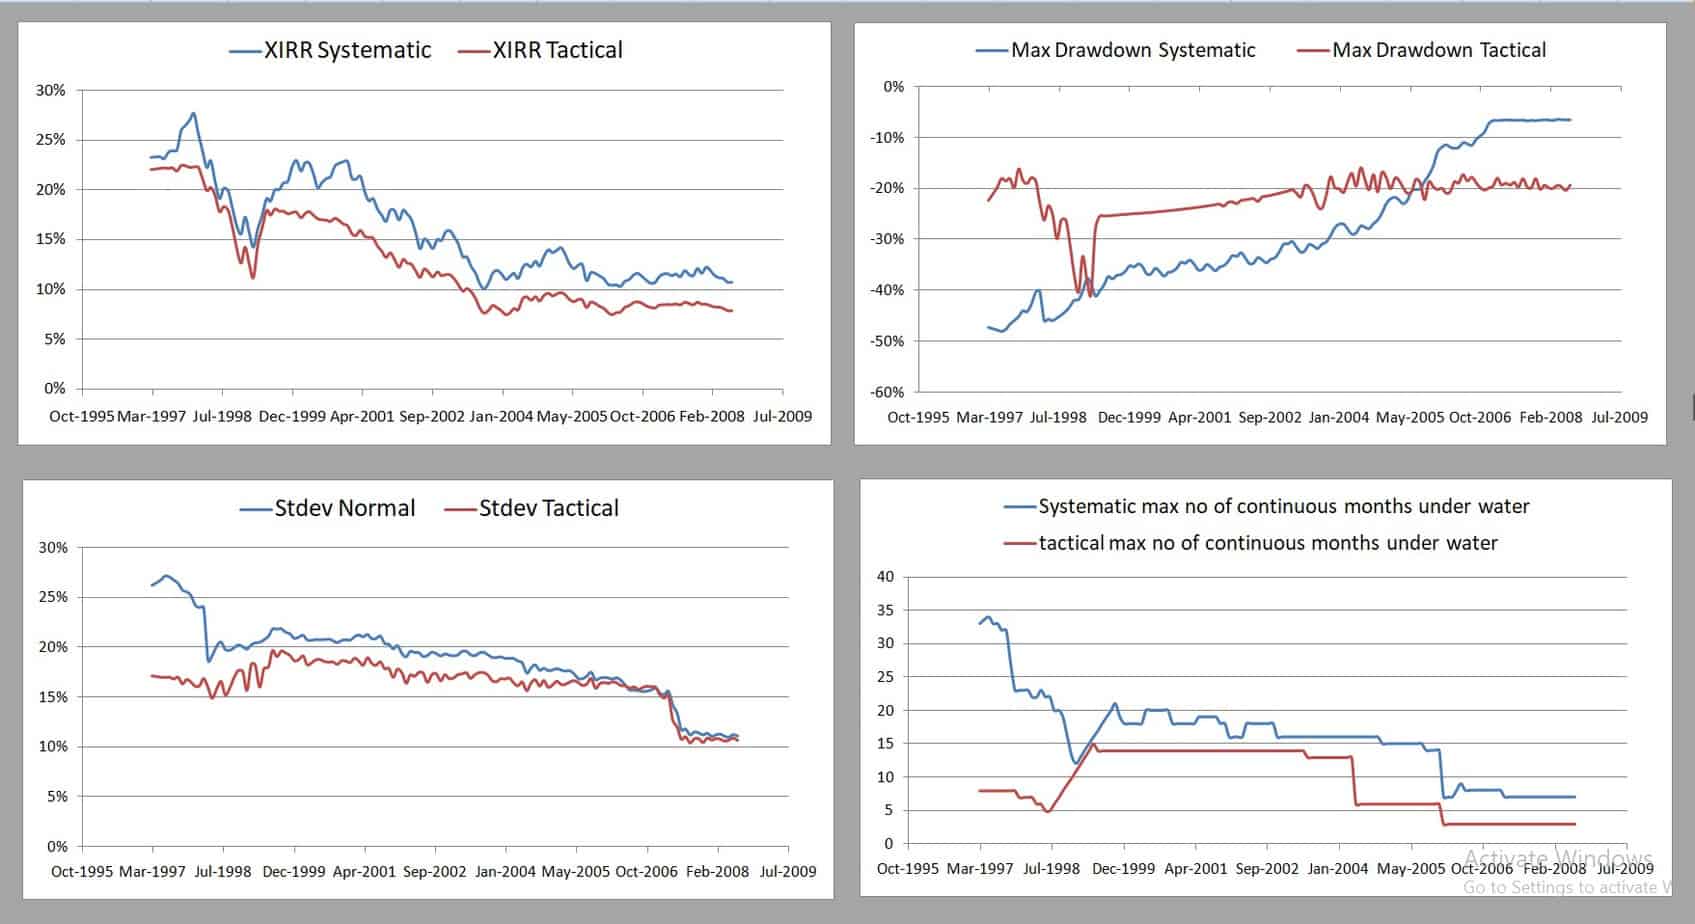
Top Left: The XIRR or returns are compared. Higher the better!
Top Right: The maximum fall of the portfolio from a peak is compared. The vertical axis is negative. So lower the value, the more the fall, the more the risk.
Bottom left: Standard deviation or how much the monthly returns fluctuate is compared. Higher the value, the higher the fluctuation, the higher the risk.
Bottom right: The no of months, the portfolio was continuously lower than a previous peak (underwater) is compared. Higher the no of months, higher the risk.
Notice PE method has done better in terms of returns only for about half the no of times (196 5Y periods were considered)
2 PE-Timing: 10-years and 50% Equity and 50% debt
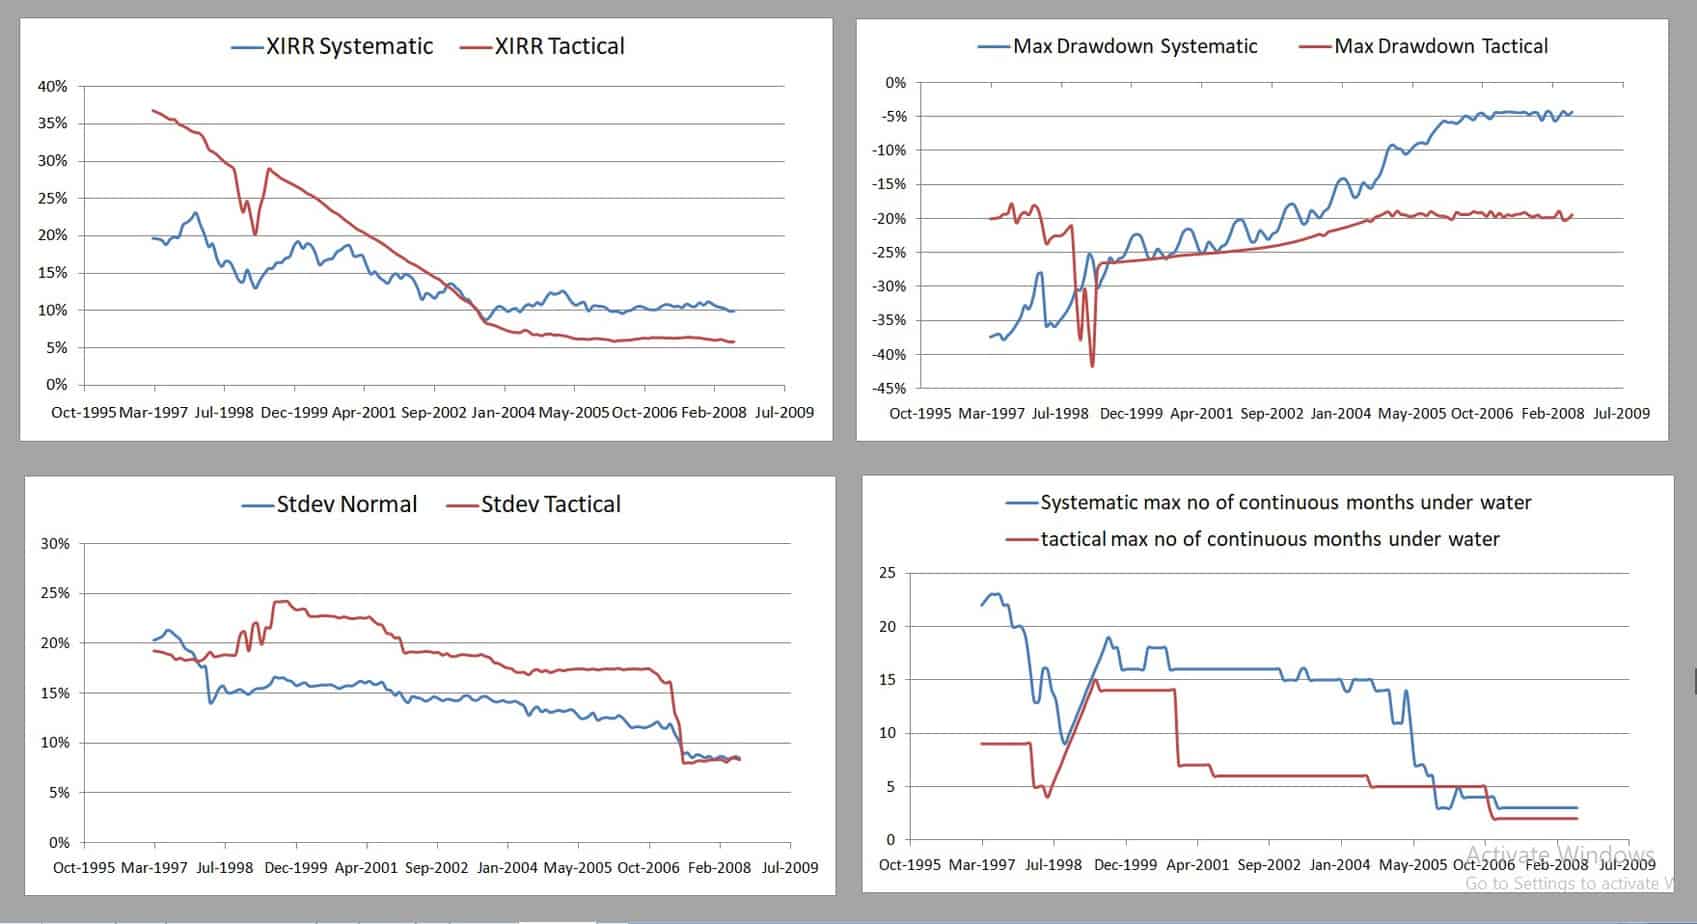
Over the long-term, the PE-based portfolio remains underwater for shorter periods of time, but the reward is not high often. A total of 136 10Y periods were considered.
3 PE-Timing: 5-years and 70% Equity and 30% debt

This is a comparison of the PE-timing strategy vs a high-risk systematic strategy over 5Y. I am surprised that the PE method still has higher risk and not always a higher reward
4 PE-Timing: 10-years and 70% Equity and 30% debt
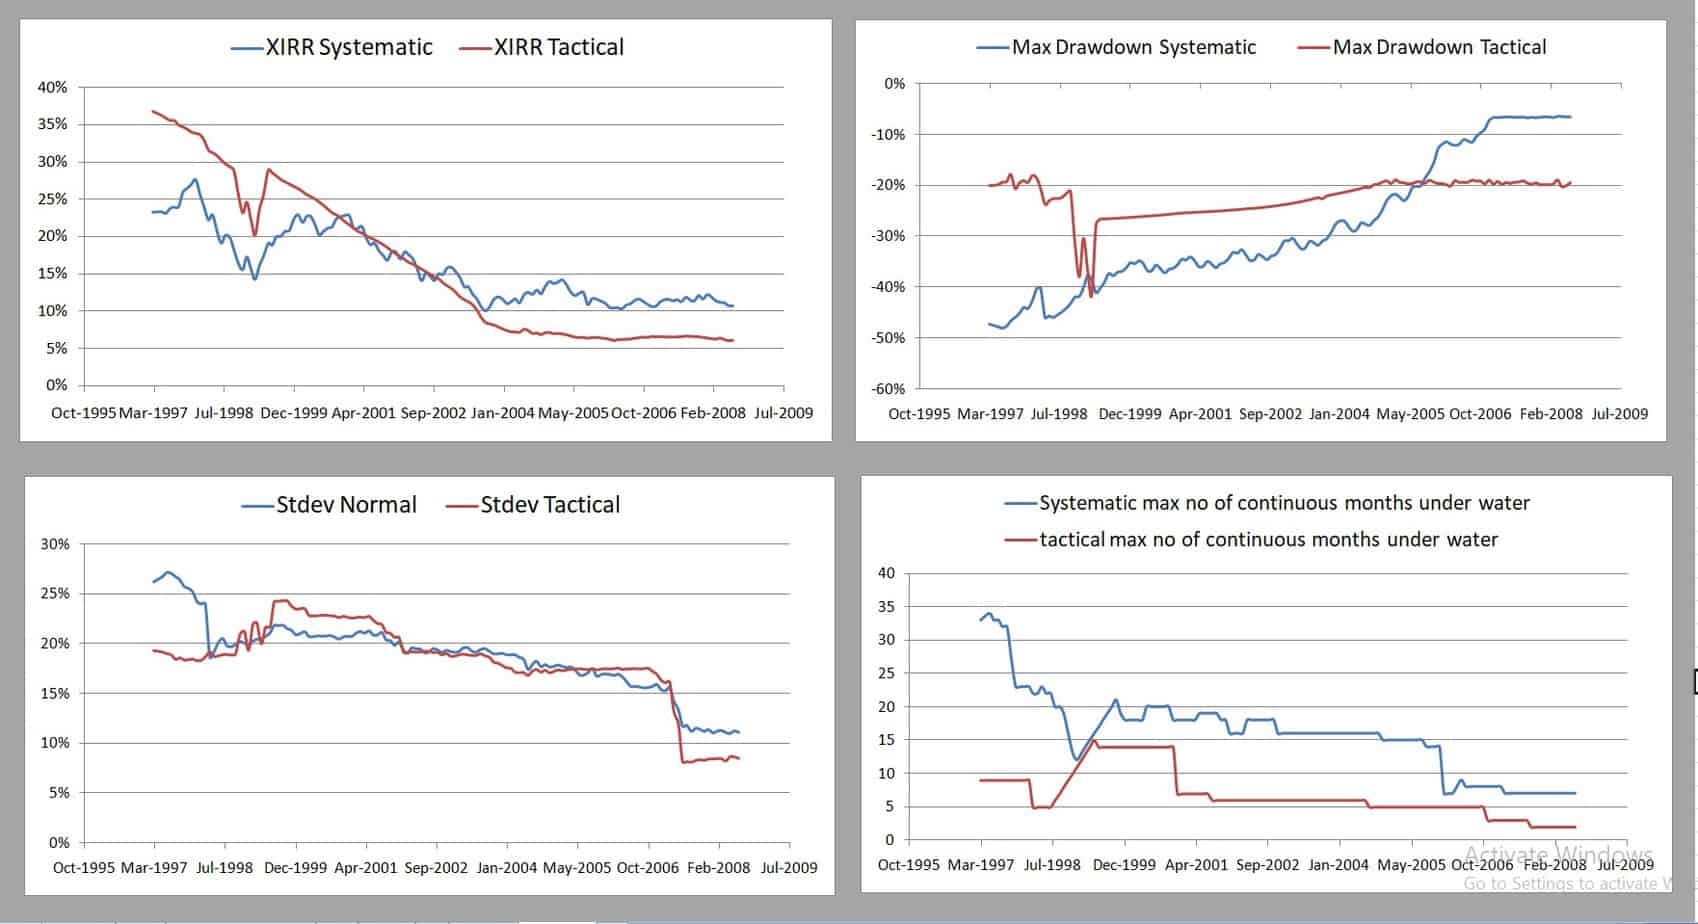
A 70% equity strategy over 10Y has a risk comparable to the PE model. The main advantage of the PE model seems to be the recovery time. The portfolio falls but does not stay lower than the peak for long (compared to the systematic method).
I have said it before and I say it again: Time the market because you desire lower risk and not because you desire a higher return. The former is much more probable than the latter.
5 PE-Timing: 5-years and 30% Equity and 70% debt
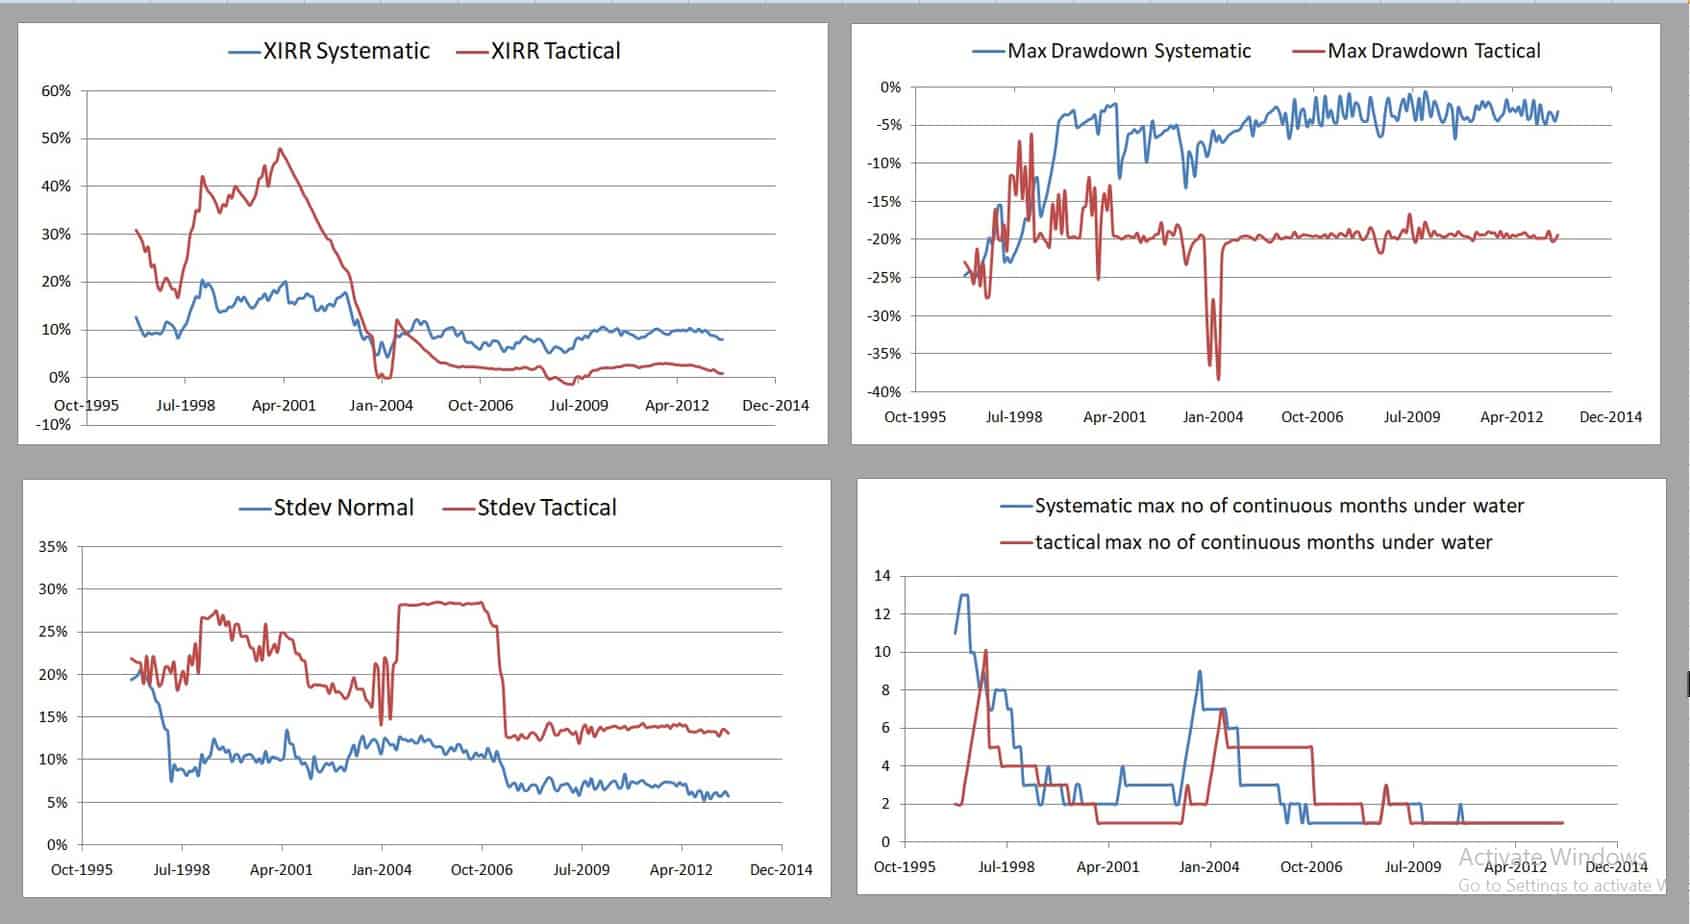
This is a comparison between a conservative systematic approach (only 30% equity) and the PE-method. It is clear that the systematic approach is better.
Overall impression: There seems to be no great benefit in adopting the PE-timing model over 5 years. Over 10Y, the no of months the portfolio is “down” is lower with timing but this does not guarantee higher returns. Now let us move on to the ten moth moving average.
6 Ten-month moving average: 5-years and 50% Equity and 50% debt
7 Ten-month moving average: 10-years and 50% Equity and 50% debt

The 10MMA model appears to be riskier than the PE-model. The no of months the 10mma model is “underwater” is higher.
8 Ten-month moving average: 5-years and 70% Equity and 30% debt

9 Ten-month moving average: 10-years and 70% Equity and 30% debt

Again the 10MMA does not seem as impressive as the systematic approach.
10 Ten-month moving average: 5-years and 30% Equity and 70% debt
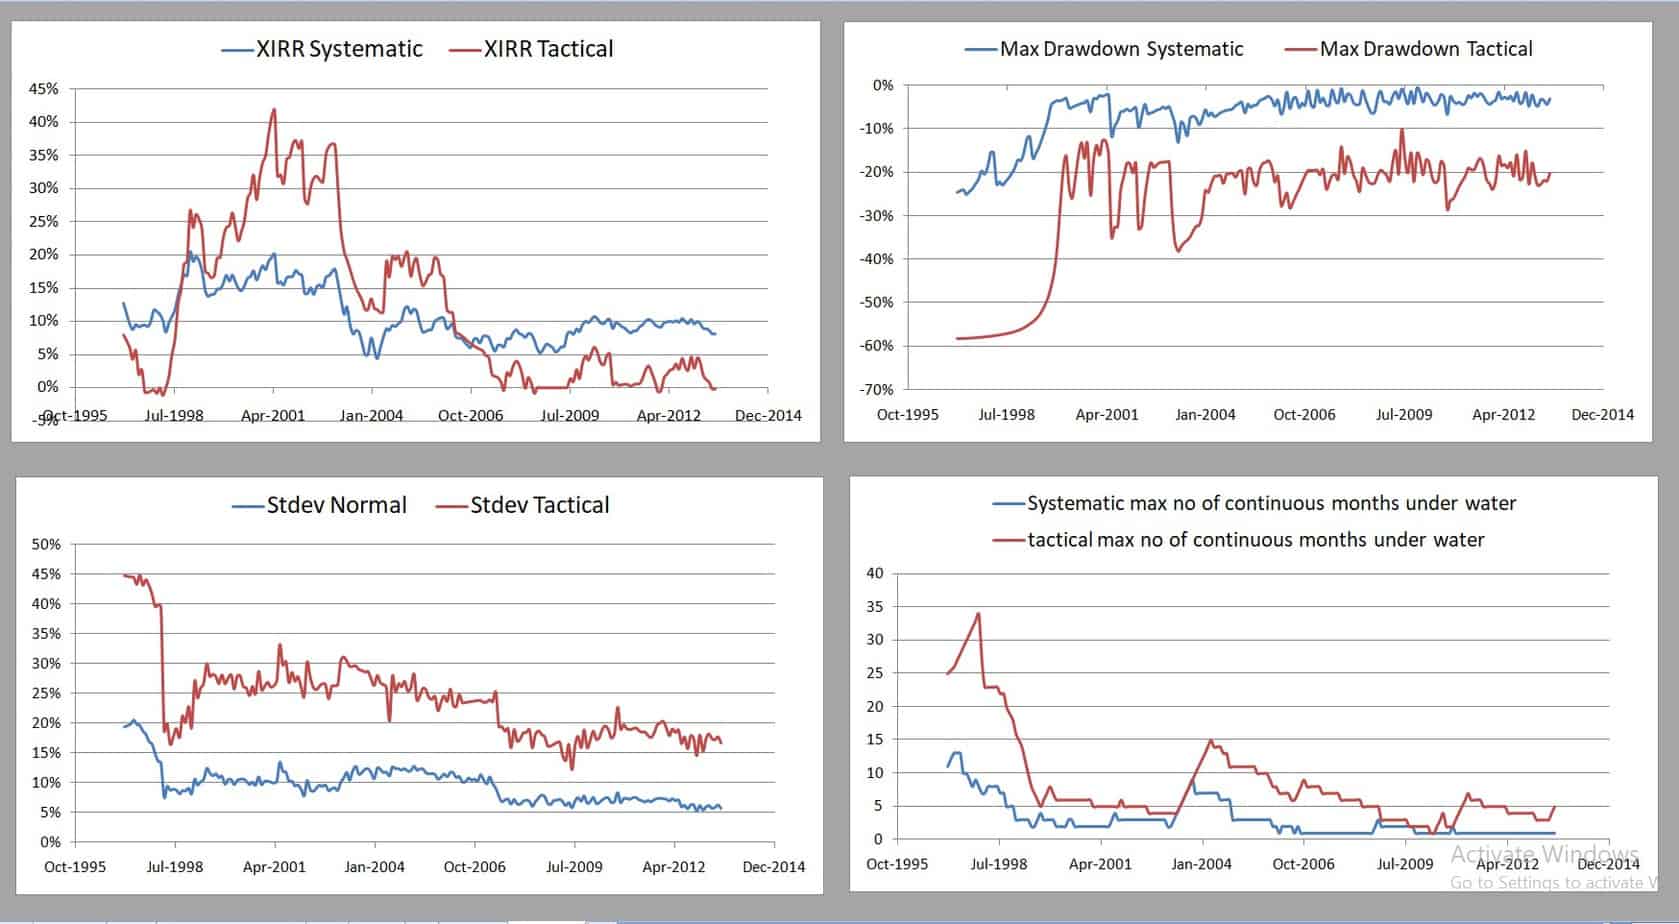
Over 5 years, if you simply held lower (30%) equity, you could have got the job done instead of timing!
We then consider a method identical to the one used by Franklin Dynamic PE Fund of Funds. This is the PE model used:
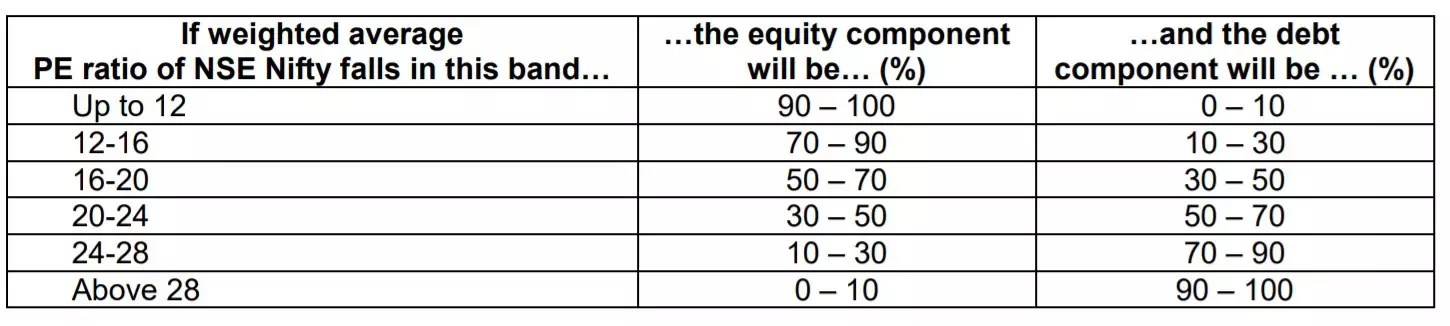
For more details see: Want to time the market with Nifty PE? Learn from Franklin Dynamic PE Fund. Quite clearly this is a lot of work and involves about 4-5 buy/sell transactions (of the existing holding) per year.
11 Franklin Dynamic PE: 5-years and 50% Equity and 50% debt
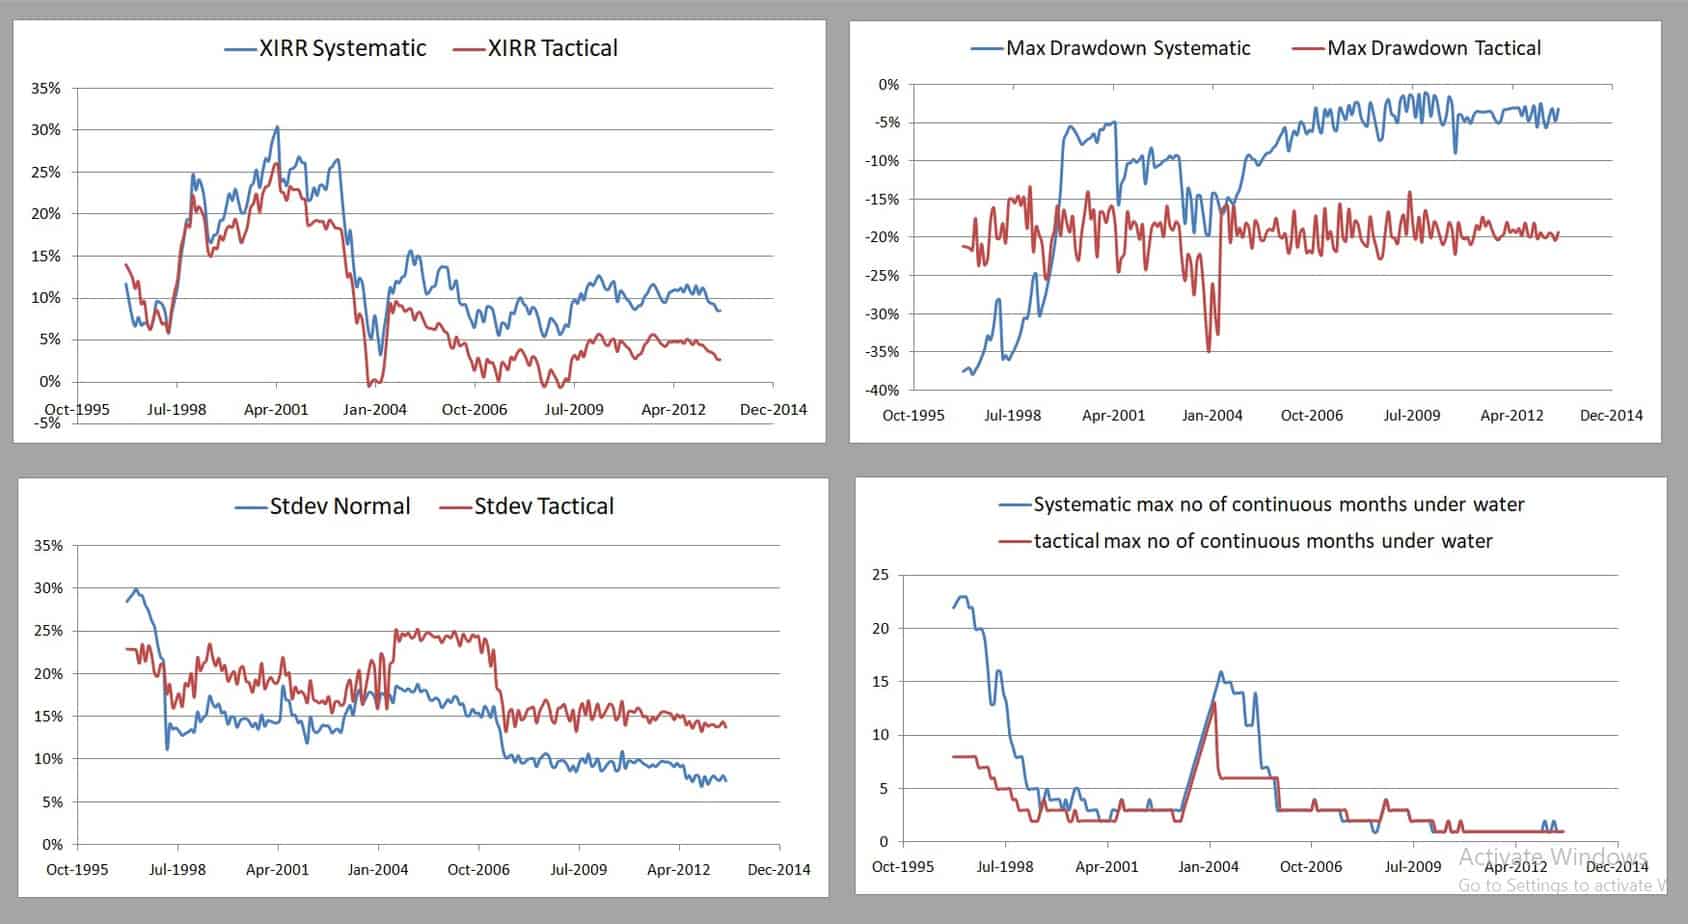
12 Franklin Dynamic PE: 10-years and 50% Equity and 50% debt
13 Franklin Dynamic PE: 5-years and 70% Equity and 30% debt
14 Franklin Dynamic PE:10-years and 70% Equity and 30% debt
15 Franklin Dynamic PE: 5-years and 30% Equity and 70% debt
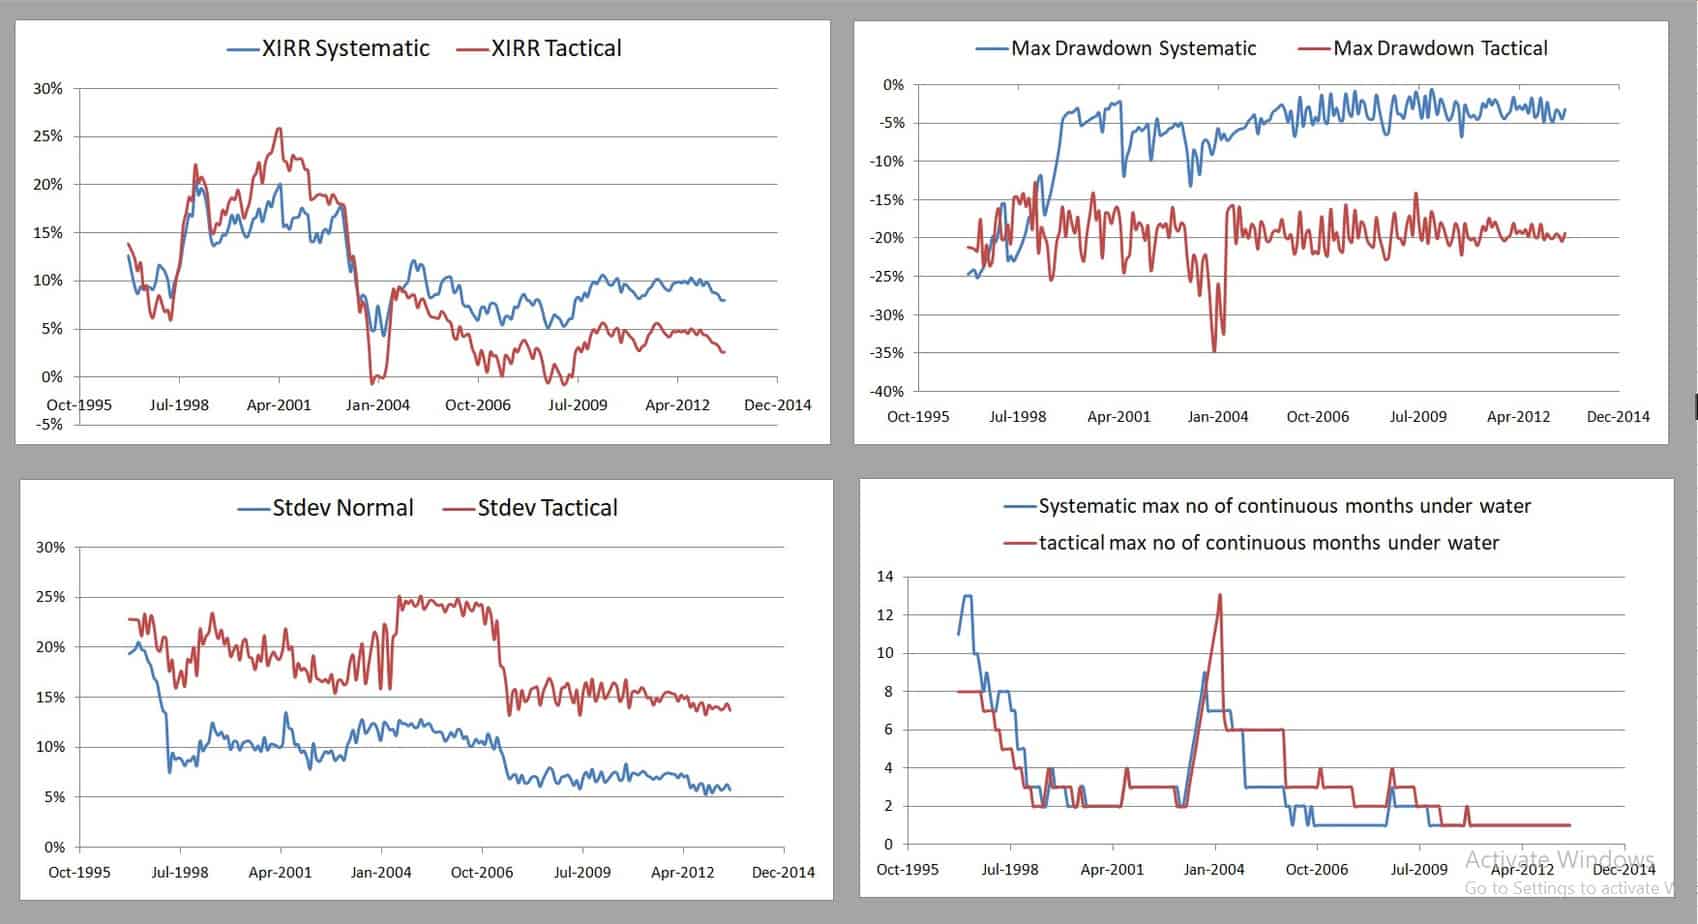
Overall impression: The Franklin Dynamic PE model does lower risk (months underwater) but the returns are more uniformly subdued. This is actually better in terms of investor expectations. It appears to fall in the lower-risk and lower return category, while the others are clearly, higher-risk with potential higher-reward.
If you actually bothered to look at all the graphs and have come up to this point, then I thank you. Reactions from readers to this series have been on expected lines. Many of them prefer to “buy more” based on market timing and not sell existing holdings. That is what we will be backtesting in the next segment.
I think this attitude stems from the impression that buying and selling involve more effort. Actually one of the most important results for me is that over a period of 10Y, the no of buy/sell transactions for the 10MMA and PE-method are only 5-6, which is fantastic. Over 5Y, the number is only about 2-3. The taxes and loads would be minimised. The FT Dynamic PE is an exception but that is as expected.
A higher-risk, higher-reward option with less than 1 transaction per year on average is simply fantastic! Yet readers seem to think it is too much work and prefer only to “buy on dips”! Hmm, plenty of behavioural insights there!
That is the next step in the series: (1) test a buying only model then move on (2) quarterly check on PE and 10MMA instead of monthly, then (3) use yield gap for timing (4) double moving averages and more as we search for the holy grail: Can we consistently lower risk and consistently (to within reason) enhance return? If you have any suggestions for the backtest, let me know.
Let me end with a question: If you are someone who thinks buying and selling existing holdings is a pain and thinks “buying on dips” is better, how many times have you rebalanced your portfolio? My answer: I rebalance (without timing) 1-2 times a year – this is a lot more then the timing backtest!!
We are on Google News
Use this button to add freefincal.com as a preferred personal finance source on Google News.

Explore 1,400+ videos on YouTube!

Subscribe to get posts via email!
Join 32,000+ readers and get free money management solutions delivered to your inbox! (Link takes you to our email sign-up form)Join our WhatsApp Channel

Explore our products
🔥Join our community of 9000+ users! 🔥- Use our Robo-advisory Tool to create a complete financial plan! More than 3,500 investors and advisors use this! Use the discount code robo25 for 20% off. Plan your retirement (early, normal, before, and after), plus non-recurring financial goals (such as child education) and recurring financial goals (such as holidays and appliance purchases). The tool helps anyone aged 18 to 80 plan for retirement, plus six non-recurring and four recurring financial goals, with a detailed cash flow summary.
- Our Flagship Course! Learn to manage your portfolio like a pro to achieve your goals regardless of market conditions! More than 3,500 investors and advisors are part of our exclusive community! Get clarity on how to plan for your goals and achieve the necessary corpus no matter the market conditions! Watch the first lecture for free! One-time payment! No recurring fees! Lifelong access to videos! Reduce fear, uncertainty and doubt while investing! Learn how to plan for your goals before and after retirement with confidence.
- Join the freefincal investor circle! An exclusive space for investors, advisors, fintech employees and students to access financial planning and insurance tools, mutual fund and stock analysis tools, coding strategies and Excel macros for data extraction. 750+ members are now part of our investor circle.
- Increase your income by getting people to pay for your skills! More than 900 salaried employees, entrepreneurs and financial advisors are part of our exclusive community! Learn how to get people to pay for your skills! Whether you are a professional or small business owner seeking more clients through online visibility, or a salaried individual looking for side or passive income, we will show you how to do it by showcasing your skills and building a community that trusts and pays you. (Watch the 1st lecture for free). One-time payment! No recurring fees! Lifelong access to videos!
- Portfolio Tracker! Track your mutual funds and stock investments with our Google Sheet!
- We also publish monthly screeners for
Our Podcast: Let's Get Rich With Pattu
On Spotify: Let's Get RICH With PATTU! Every single Indian CAN grow their wealth! On Audible: Listen to the Let's Get Rich with Pattu Podcast

Listen to the Let's Get Rich With Pattu podcast on YouTube.
Now watch Let's Get Rich With Pattu தமிழில் (in Tamil)!About The Author

Dr M Pattabiraman giving a lecture
- Dr M. Pattabiraman (PhD) is the founder, managing editor and primary author of freefincal. He is an associate professor at the Indian Institute of Technology, Madras.
- He has over 14 years of experience publishing news analysis, research and financial product development. He has over 28 years of teaching and research experience. He is also a public speaker and keynote presenter.
- He is a patron and co-founder of “Fee-only India,” an organisation promoting unbiased, commission-free, AUM-independent investment advice.
- Connect with him via @pattufreefincal on X LinkedIn YouTube
- Pattabiraman has co-authored three print books.

This book helps you ask the right questions and find the right answers. It also includes nine online calculators to create custom solutions.
(2) Gamechanger: Forget Startups, Join Corporate & Still Live the Rich Life You Want. 

Both the boy and girl versions of "Chinchu Gets a Superpower".
Most investor problems stem from a lack of poor decision-making. We made bad decisions and money mistakes when we started earning, and we spent years undoing them. Why should our children go through the same pain? What is this book about? As parents, what if we had to groom one ability in our children that matters not only for money management and investing but for every aspect of life? My answer: Sound decision-making. So, in this book, we meet Chinchu, who is about to turn 10. The story follows what he wants for his birthday and how his parents plan it, while also teaching him key ideas about decision-making and money management. What readers say! 
Feedback from a young reader after reading Chinchu Gets a Superpower!
Must-read book even for adults! This is something that every parent should teach their kids right from a young age. The importance of money management and decision-making based on their wants and needs. Very nicely written in simple terms. - Arun.
About freefincal & its content policy
Freefincal is a News Media organisation dedicated to providing original analysis, reports, reviews and insights on mutual funds, stocks, investing, retirement and personal finance developments. We do so without conflict of interest and bias. Follow us on Google News. Freefincal serves more than three million readers a year (5 million page views) with articles based only on factual information and detailed analysis by its authors. All statements made will be verified with credible and knowledgeable sources before publication. Freefincal does not publish paid articles, promotions, PR, satire or opinions without data. All opinions will be inferences backed by verifiable, reproducible evidence/data. Contact Information: To get in touch, please use our contact form. (Sponsored posts or paid collaborations will not be entertained.)Our publications
- Your Ultimate Guide to Travel. This is an in-depth exploration of vacation planning, including how to find affordable flights, budget accommodations, and practical travel tips. It also examines the benefits of travelling slowly, both financially and psychologically, with links to relevant web pages and guidance at every step. Get the PDF for Rs 300 (instant download)

- How to profit from content writing: Our ebook is for those interested in getting a side income via content writing. It is available at a 50% discount for Rs. 500 only!