We are studying the efficacy of a double moving average market timing model with different stock market indices. We have already established that the model reasonably works (see links below) across asset classes. Our primary goal in this updated study is to illustrate market-specific risks and the sequence of returns risk with market timing.
It will take a few articles for these risks to unfold so we request some patience from the reader. Please do not jump to conclusions on the suitability or unsuitability of the model until all results are in. In part 1, we covered Nasdaq 100 and now we shall look at S&P 500 TRI (USD).
It must also be understood that market-specific risks and sequence of return risks are also applicable to systematic investing. The aim of this is to point out that no strategy (systematic or tactical) will work all the time and will work for all markets.
We have already established the above observation for systematic investing several times in the past. See: Do not expect returns from mutual fund SIPs! Do this instead! And Stock market always moves up in the long term but returns move up and down!
Past work: We have already established that the double moving average method is reasonably effective from an analyst’s point of view.
🔥Secure your future with our Robo-advisory tool trusted by over 3,500 investors and advisors. From effortless retirement planning to funding your children’s biggest dreams, turn your financial goals into reality. 🔥
Subscribe for money management solutions via email! (Link takes you to our email sign-up form) Join 32,000+ readers in our community.
👉 New Tool Alert! NaviPlan: A Privacy-Focused Multi-asset Tracker and Goal Planner 👈
- Gold (1) Is this a good time to buy gold? A tactical buying strategy for gold
- Equity (large cap) (2) This “buy high, sell low” market timing strategy surprisingly works!
- Equity (Small cap) (3) Do not use SIPs for Small Cap Mutual Funds: Try this instead!
- Gilts (4) Can we get better returns by timing entry & exit from gilt mutual funds?
- Gilts updates (5) Is it possible to time entry and exit from gilt mutual funds for better returns?
- We have also developed a tool based on this strategy: A tool for tactical buying and selling using moving averages
- For other tactical strategy backtests (eg. with PE), explore the Tactical Asset Allocation archives.
All our articles on the subject come with lengthy disclaimers about the risks of market timing. We now have an opportunity to showcase the risks with some hard data.
That said, we would also like to point out that the stance taken by the financial services community in general about market timing is wrong. If someone says “Mount Everest can never be claimed”, they are clearly lying. If someone says, “It is extremely hard to climb Mount Everest, then they are being pragmatic”.
The financial services industry has conveniently changed pragmatism (it is hard to time the markets) into a convenient lie (“the markets cannot be timed”).
Is it possible to the time the capital markets? The answer is a resounding “yes”.
Is it possible to find one timing method that will work all the time? The answer is a resounding “no”. Just like systematic investing will not be fruitful at all times, timing will not also provide a reward commensurate with risk at all times.
Can the typical retail investor pull off-market timing? Unlikely. Timing requires higher discipline than systematic investing (which is often nothing more than automation). Most investors fear taxes and avoid rebalancing. Tactical strategies require equity to debt switches or vice versa at least once a year!
At freefincal, we deal with facts. We do not moralise on right and wrong and fudge facts. If you are easily confused and believe less is more, then we recommend not reading this series.
They say “emotions cannot be backtested”. Fair enough. But then such people should not hail the merits of systematic investing for emotions wreak havoc there too!
Warning and disclaimer: Please recognise results shown in backtests do not factor in future market movements especially sharp price fluctuations and sequence of returns, human emotions, taxation and exit loads. All these would impact the outcome of market timing.
Tactical (double moving averages) vs Systematic Investing: S&P 500 TRI (USD)
We shall use S&P 100 TRI (USD) for the test from Jan 1900 to May 2022 using the Excel maintained at Prof. Robert Schiller’s website. Data is available from 1871 but Excel cannot handle dates prior to Jan 1900.
The index need not be converted into INR since the USD-INR conversion is common to both strategies. For the debt part, we consider a fixed-income instrument offering 2.8% a year.
Systematic investing: A sum is invested each month in equity and debt. We shall consider 50% equity and 50% debt over 5 years, 10 years and 15 years. The portfolio is rebalanced annually. Taxes and exit loads due to this are not considered.
Tactical investing: If the six -months moving average (6MMA) of the S&P 500 is greater than the 12-month moving average (12MMA) then all debt holdings are sold and invested in equity. All future investments are also made in equity.
If 6MMA < 12 MMA, then all equity holdings are sold and invested in debt. All future investments are also made in debt. Tax and exit load due to the switches are not considered. However, typically the average number of switches is lesser than annual rebalancing. For example, the no of buy/sell switches over 5 years is only about twice on average; is about 4 on average over 10 years; and about 5 on average over 15 years.
This is an example of a single 15-year run.
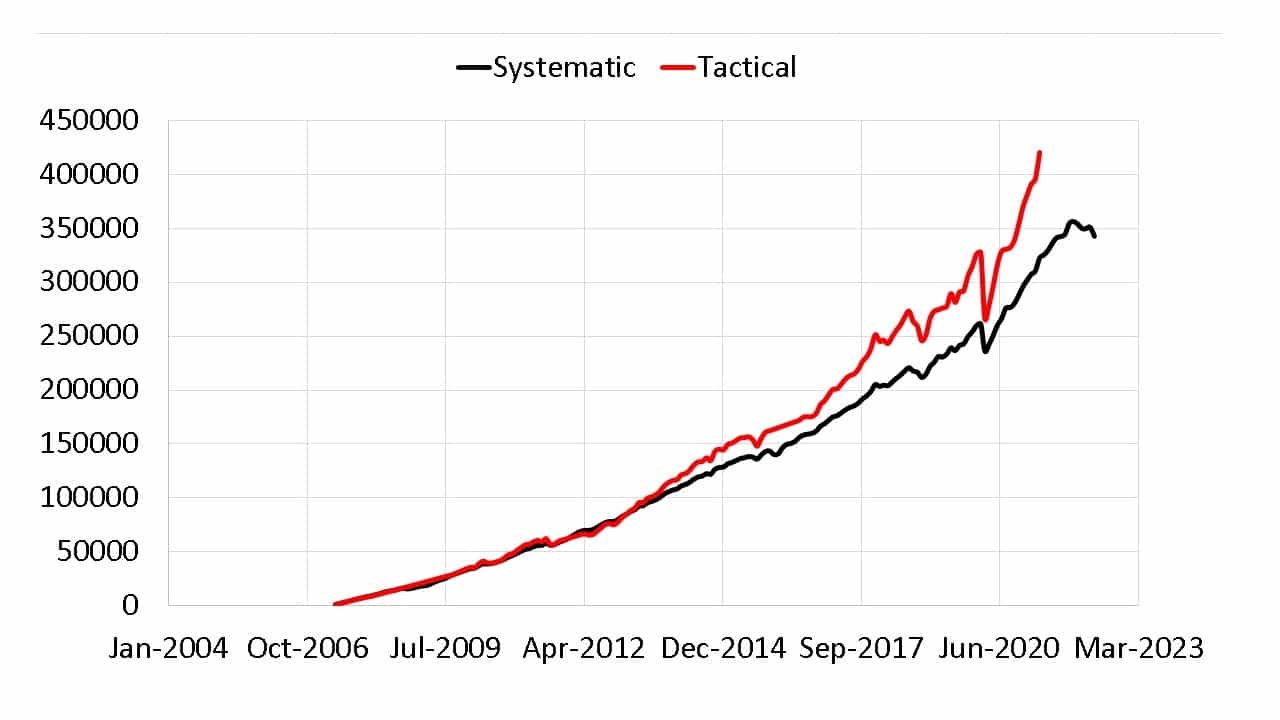
Between April 1999 to May 2022, 1289 such 15-year windows are possible when rolled over monthly. The results for these are shown below.
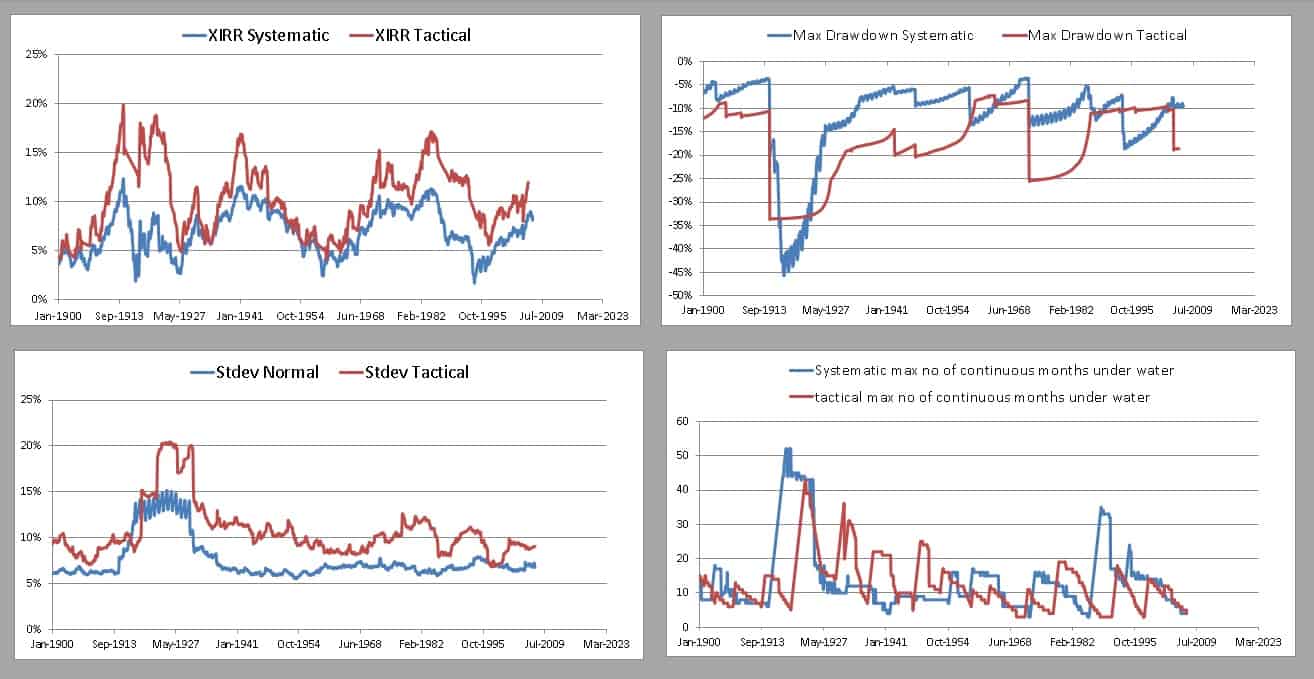
Double moving average vs systematic – data for 15-years backtest with 50 per cent equityTop left panel: the XIRR. For the period studied, the tactical strategy has done quite well.
Top right panel: The maximum drawdown (max fall from peak) of the portfolio is shown (less negative the better). The tactical strategy often has a higher drawdown. That is a higher risk.
Bottom left panel: The standard deviation or volatility (lower the better). The tactical approach has higher volatility.
Bottom right panel: the max no of months the portfolio was below its peak or underwater (lower the better). Often the tactical strategy takes longer to recover.
It must be understood that the results depend on the asset allocation chosen. For example, the above is 50% equity and 50% debt. If we change this to 70% equity and 30% equity then the results over 15 years look like this.
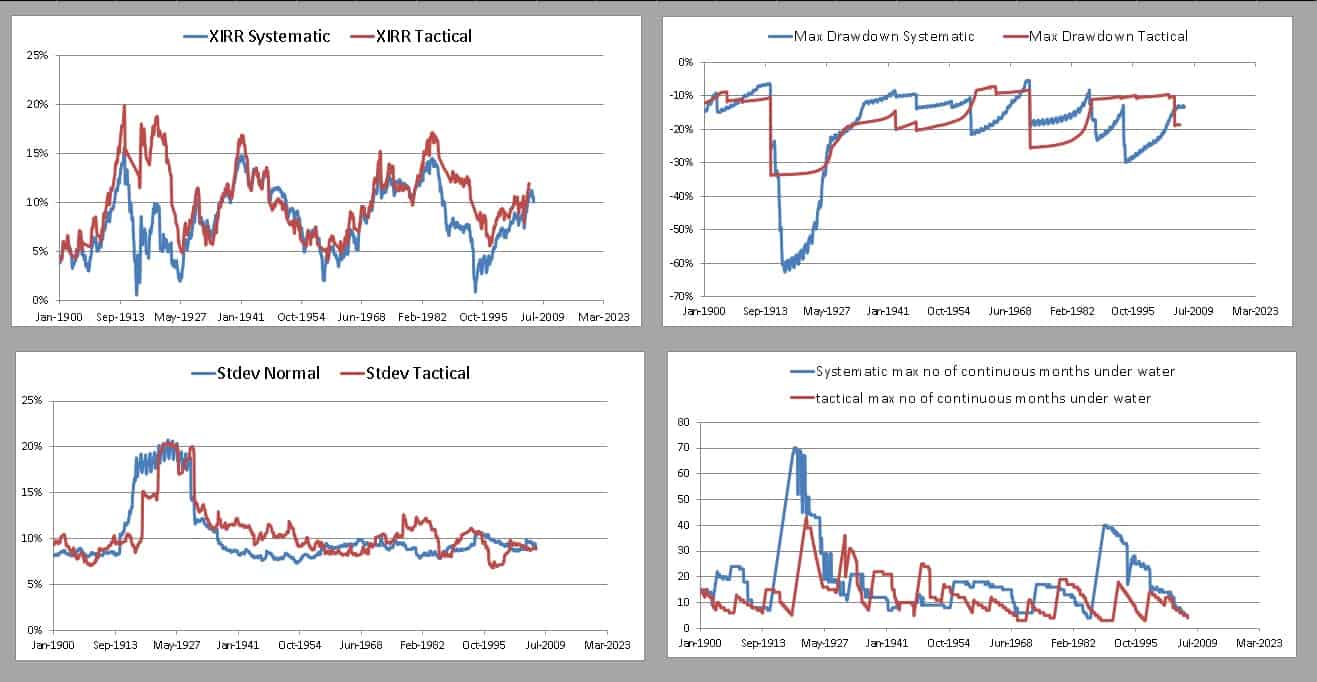
Notice that the margin of outperformance of the tactical strategy has significantly reduced. The tactical strategy is less rewarding more often compared to the 50:50 allocation. However, it has not (yet) failed dramatically.
The higher risk associated with the tactical strategy has also decreased. This pattern is also observed over 10 and 5 years. This is a key feature that must be always kept in mind.
We shall present results below over 10 and 15 years and for both asset allocations.
50% Equity and 50% debt over 10 years (1349 intervals)
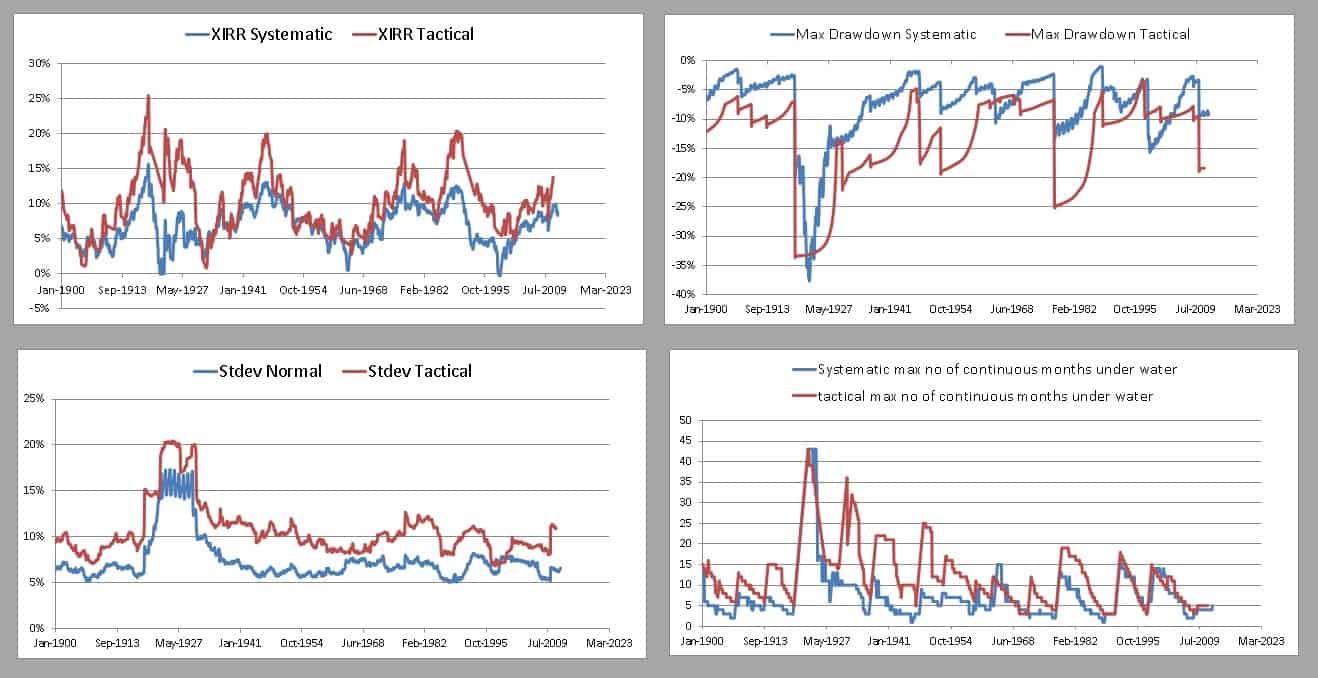
70% Equity and 30% debt over 10 years
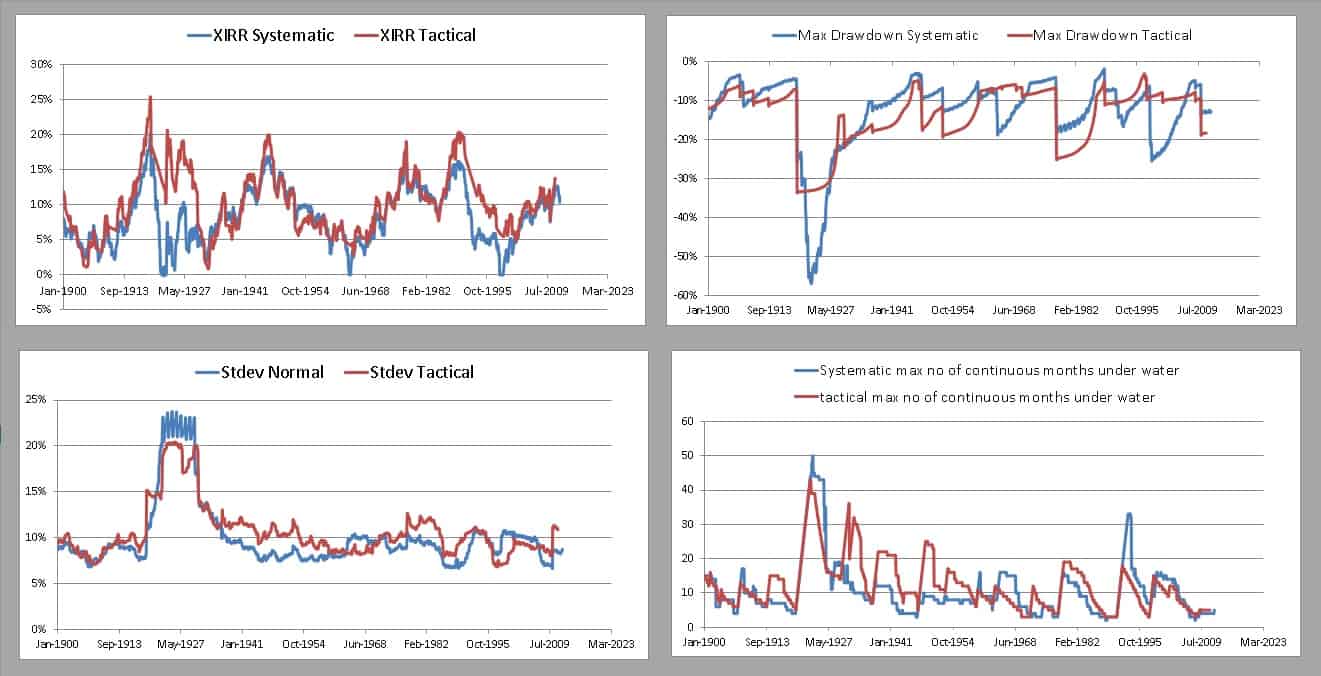
50% Equity and 50% debt over 5 years (1409 intervals)
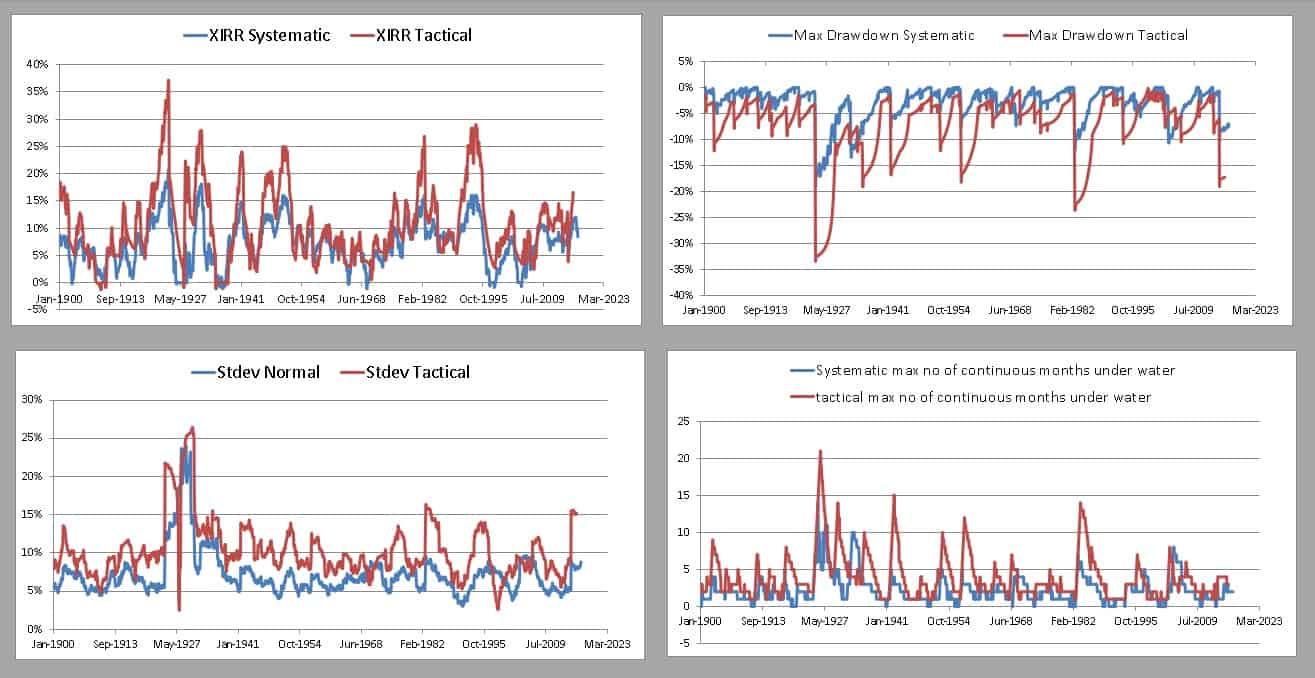
70% Equity and 30% debt over 5 years
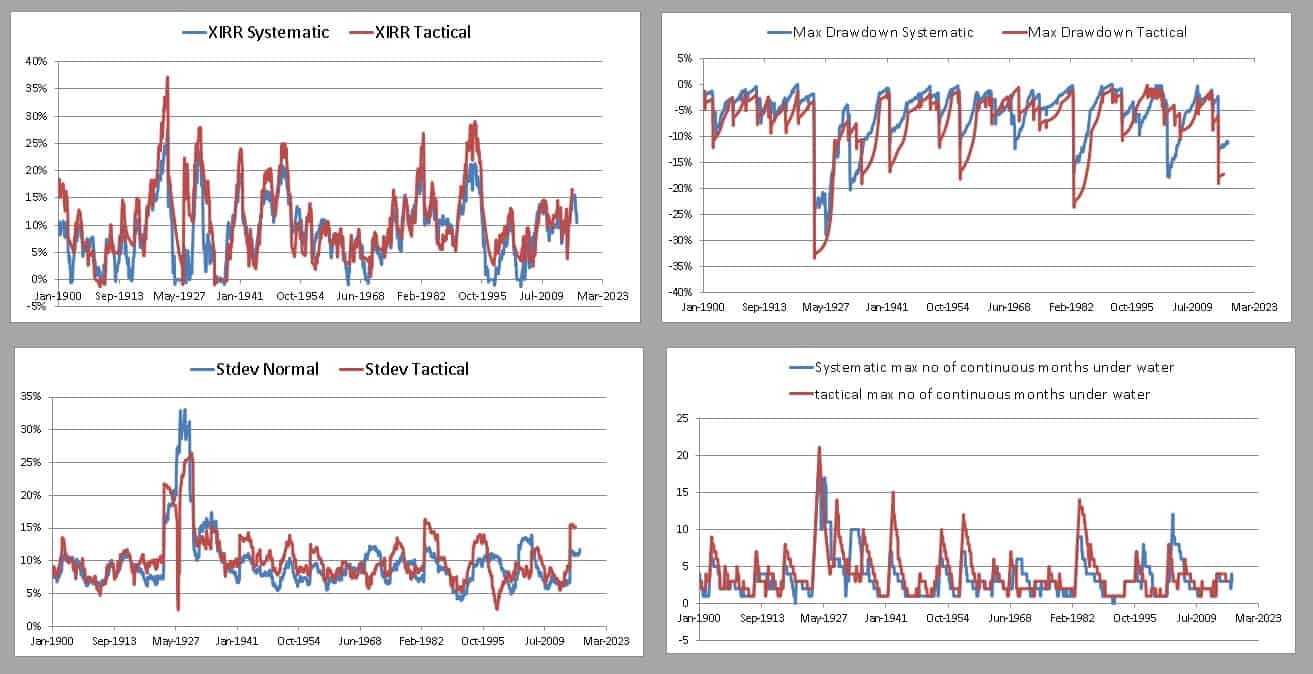
The above results indicate that the double moving average based tactical strategy has a higher risk than systematic investing. For S&P 500 just like what we showed for Nasdaq 100, for the duration and asset allocations considered the strategy has, more often than not, offered a higher reward than systematic investing. At the very least, it should be clear that the tactical strategy does not dramatically fail.
This does not however mean it will work in future or with other markets as we shall see over the next parts of the series. In the next part, we will consider gold and then move onto Indian indices