Use this nifty valuation tool to find out if the stock market is expensive or cheap using PE, PB, Div Yield, Bollinger Bands and much more. The idea to try and understand the state of the market using multiple methods. An example of some of the results obtained with this sheet is here: Are we now in a bear market?
Four different types of indicators can be used: Trend, volatility, momentum, and valuation. The sheet can be used for periodic profit booking or market timing or tactical asset allocation. It can also be used for buying on dips, but I would recommend reading this first: Buying on market dips: How effective is it?
Disclaimer: The sheet provided below is informational/education in nature. It will tell you the results of various indicators, but will not tell you when to buy or sell or do anything. That judgment is entirely up to the user. The sheet has been extensively tested for bugs and there are no known bugs at this time of release. However, it is not possible to guarantee that the sheet is free of errors. Users can bring issues to my notice for evaluation. I am not responsible for gains or losses that the user may suffer by using this tool
Many investors sit and fret if the market is overvalued and if this is the right time to invest or not. This sheet can provide quantitative insight into the state of the market. Instead of looking at only the PE or a moving average, it would be better if different types of indicators are used to check stock market valuation. Sometimes multiple indicators may agree with each other and sometimes no. During such times the user will have to use their discretion and judgment. We shall look at examples of each indicator type available and how to interpret them.
🔥Secure your future with our Robo-advisory tool trusted by over 3,500 investors and advisors. From effortless retirement planning to funding your children’s biggest dreams, turn your financial goals into reality. 🔥
Nifty Valuation Tool: List of indicators available
Indicator Type: Trend
Simple moving average (180 and 365 days, the duration can be set by user)
Exponential moving average (180 and 365 days, the duration can be set by user)
Moving Average Convergence Divergence (MACD)
Indicator Type: Volatility (plus trend)
Bollinger bands with 200 days DMA
Indicator type: momentum
Relative Strength Indicator
Indicator type: Valuation
Price to earnings ratio (PE) with 10-year moving average and standard deviation bands
Price to book value (PB) with 10-year moving average and standard deviation bands
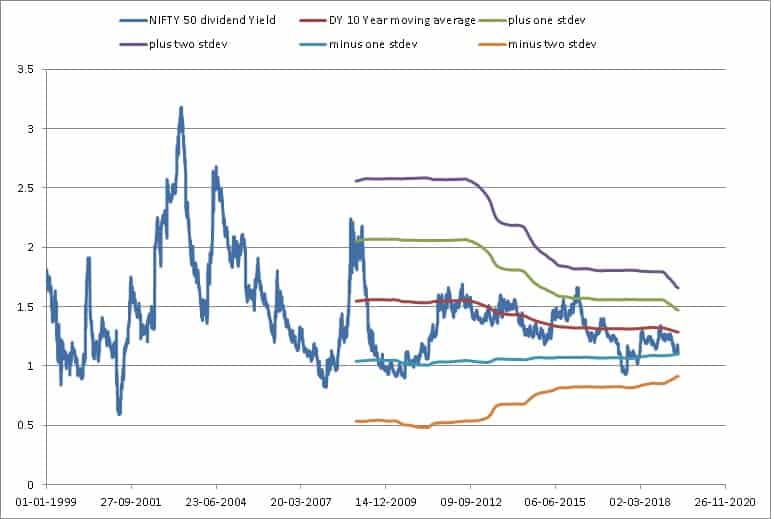
Dividend Yield with 10-year moving average and standard deviation bands
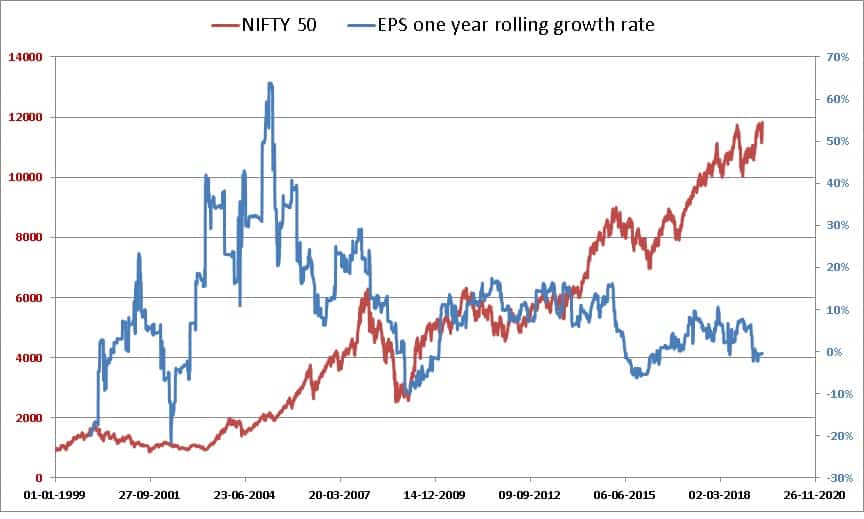
EPS Growth rate
ROE or book yield
Simple moving average
Stock market price movements on a daily basis are too noisy. So to spot trends, we need to smoothen them. One can take the average of the last 200 day prices for this. To spot bullish and bearish trends, a double moving average is used: One for about 180 days (6 months) and another for about 365 days (12 months).
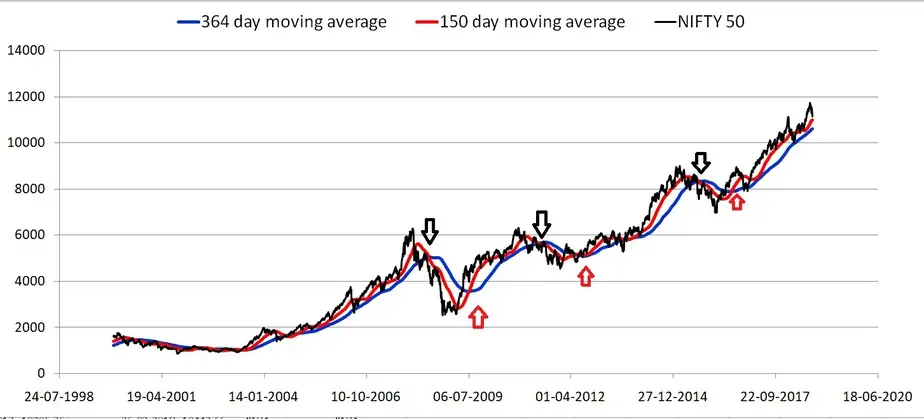
Sometimes the period would be 180 days or 179 days or 181 days depending on the index used. Here is an example:
A bearish trend is possible when the 150-day average falls below the 364-day average- downward arrows. A bullish trend is possible when the 150-day average moves above the 364-day average – upward red arrows.
The problem is, sometimes both these averages will cross each other in quick succession (see below) a problem known as whipsaw. To prevent this, we use the exponential moving average
Exponential Moving Average
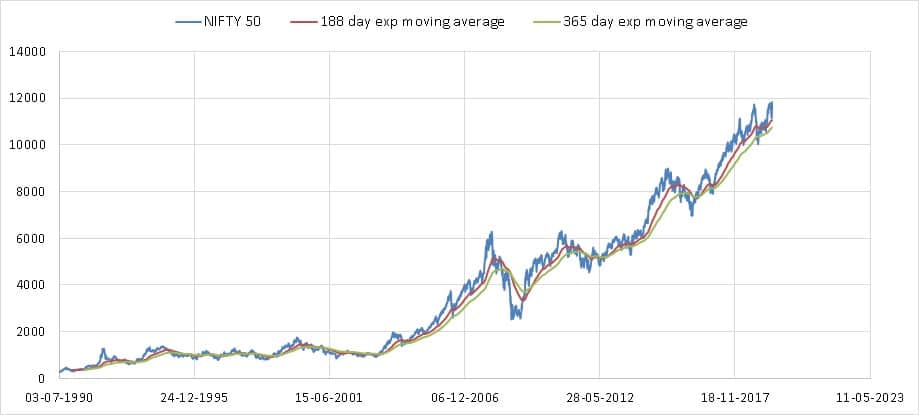
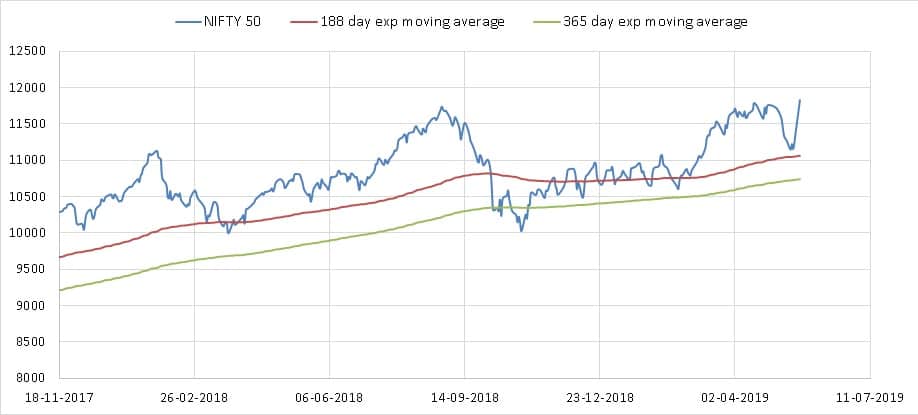
The standard alternative to the simple moving average (SMA, also known as daily moving average or DMA) is the exponential moving average. (EMA) This offers higher weight to recent price movement and responds faster than the simple moving average as seen below. The weight to older data decreases exponentially and hence responds faster.
If we go by the double EMAs, the market has been bullish for a while now.
Moving Average Convergence Divergence (MACD)
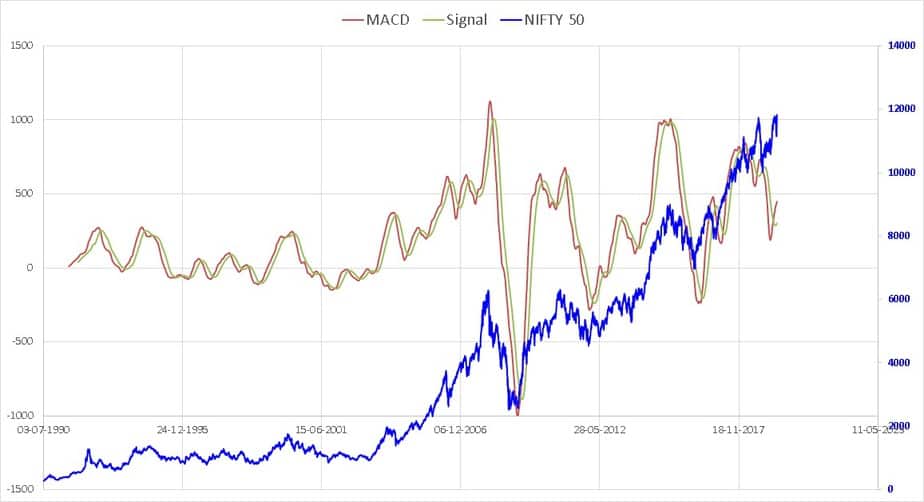
A potentially more sensitive method is to compute the difference between the two EMAs above and then take the moving average of the difference. The MACD seen below is the difference between the 188-day EMA and 365-day EMA. The average of this difference is known as the MACD signal or simply the signal. I have used a 136-day average.
Down-trend: When the MACD goes below its signal.
Up-trend: When the MACD goes above its signal.
Bollinger Bands
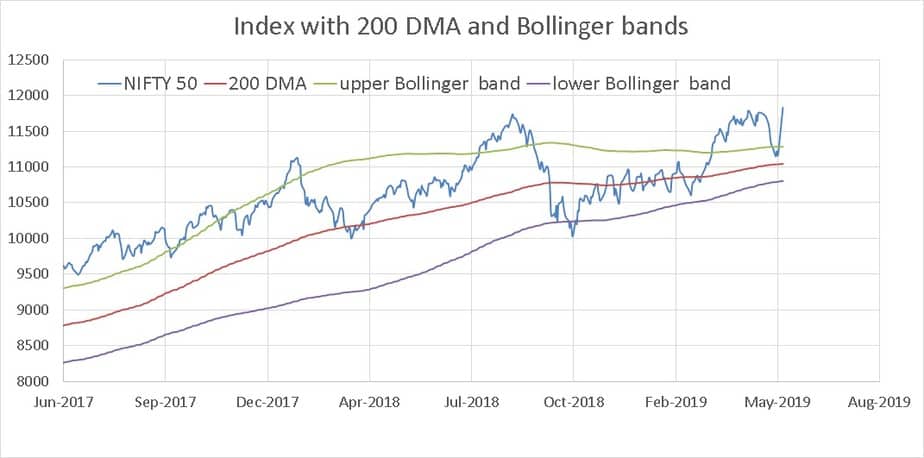
This technique helps us make better decisions with the 200-day moving average and also gives us insights on market volatility. Bollinger bands are essentially rolling standard deviation bands for the 200 DMA. The upper band is usually set two standard deviations above the 200 DMA and the lower band set at two below.
Volatility indication When the upper and lower bands converge with the 200dma moving up, it could mean bullish trend. When the upper and lower bands converge with the 200dm a moving down, then it could indicate a bearish trend.
You can spot both a bullish trend (200 DMA above the upper band) and the bands coming together (decrease in volatility). that does not happen often!!
Buy/sell indication With the bands reasonably spaced apart, if the price hits the upper band, it could mean an overheated market and a sell indication. That is a bearish market outlook. With the bands spaced reasonably apart, if the price hits the lower band, it could mean a buy indication.
Relative strength indicator
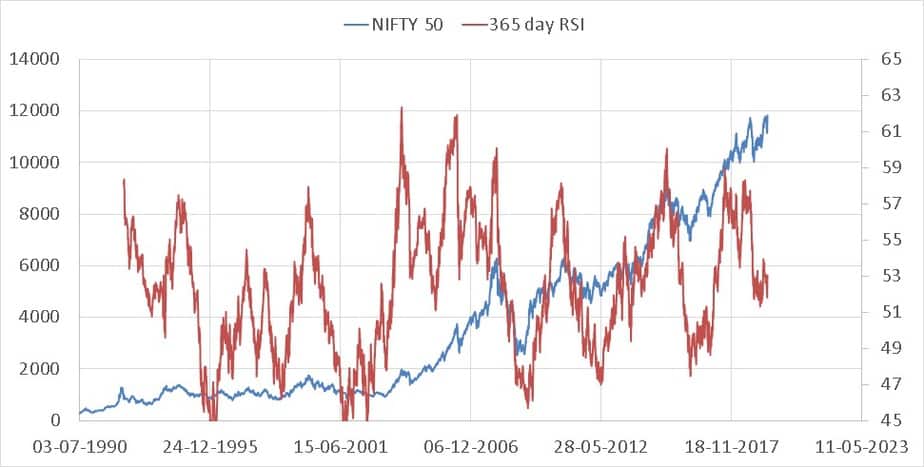
The simplest definition of the RSI is that it represents recent average gains divided by average losses. If the avg gains are higher than the index is overbought. If the avg losses are higher, the index is oversold. The problem with the RSI is similar to that of the PE or PB ratios. It is based on arbitrary high or low numbers. I have plotted the 365-day RSI for the Nifty below. It is more useful as a buy indicator than a sell indicator.
A low RSI value is a reasonable buy indicator. Current values are not too high.
Nifty PE Valuation
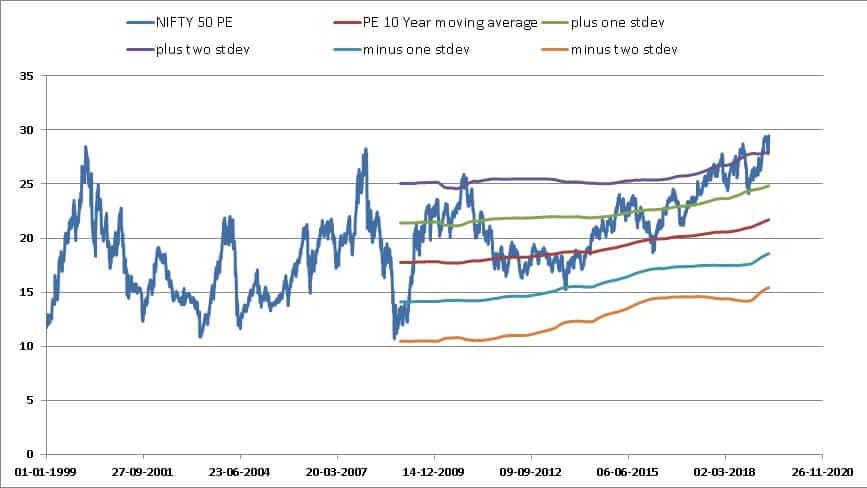
The PE ratio is the current price divided by the earnings per share of the index. If the PE is “too high” then the market is paying too high a price for the earnings and must “correct” down (I hate that word now!). If the PE is “too low” then the market is paying too low a price and must correct up.
Have a look at the 10-year moving average (avg) of the Nifty 50 PE (the center line below). The standard deviation (stdev) tells you how much each Nifty PE value deviates from the average. The two lines above the central average line represent:
avg + stdev
avg + 2*stdev
Similarly, the two lines below the central average line represent:
avg – stdev
avg – 2*stdev
Typically when the current Nifty PE hits the +2 stdev line, it tends to come down (this is NOT mean reversion!), but the problem is, it need not come down too much!! So Current PE > + 2 stdev does not mean a crash!!
Nifty PB Valuation
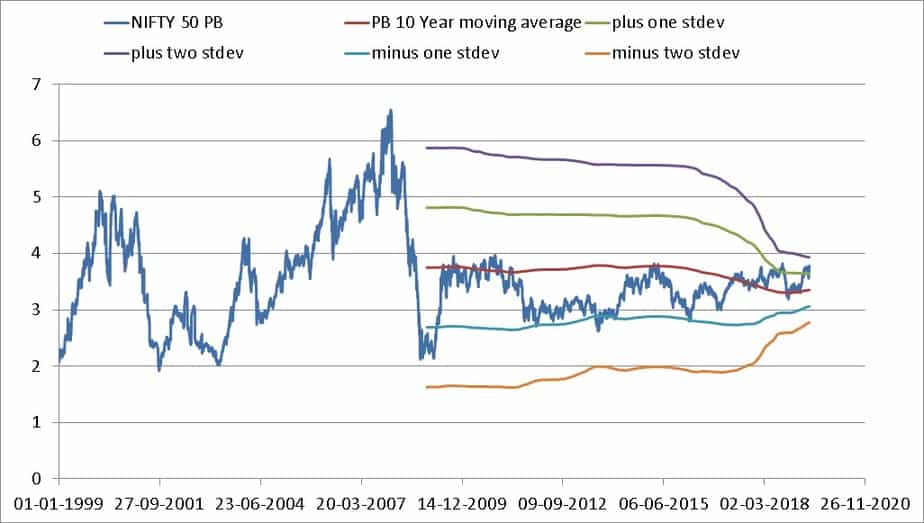
Arguments made above can also be used to gauge valuation using the price to book value. The book value or shareholders is a measure of asset assets – liabilities. So it is a bit like the NAV of an ETF and the current market price the price of the ETF.
Again, a high PB could mean a “correction” and low PB, time to buy. A conservative market timer could use PB instead of PE.
Dividend Yield
The dividend yield is a contra-indicator. That is a low value could mean over-valuation and vice-versa. The dividend yield of a single stock is computed as the most recent dividend* / current price. A high dividend yield implies the stock price has moved up faster than its dividend and vice versa. Hence low div yield of the index points to overvaluation and vice versa. Current Nifty Dividend Yield is fairly low indicating overvaluation.
* Sometime multiplied by 4 to annualize it.
EPS one-year growth rate
Earnings per share = Price/PE. The one-year growth in the EPS is shown below. in 2002, a sudden drop in interest rates triggered the EPS growth rate and a bull run. Notice that in recent years, there is virtually an absence of EPS growth. This is why I mentioned Do not start dreaming of a bull run even IF exit polls are right!! A bull run accompanied by an increase in EPS growth rate is a healthy bull run.
ROE or Book Yield
PB divided by the PE gives Earnings per share divided by book value per share. This is also known as return on equity or book yield. This is a profitability measure. Unfortunately, this has been moving south. Again, an increase in price accompanied by an increase in ROE is a healthy bull run.
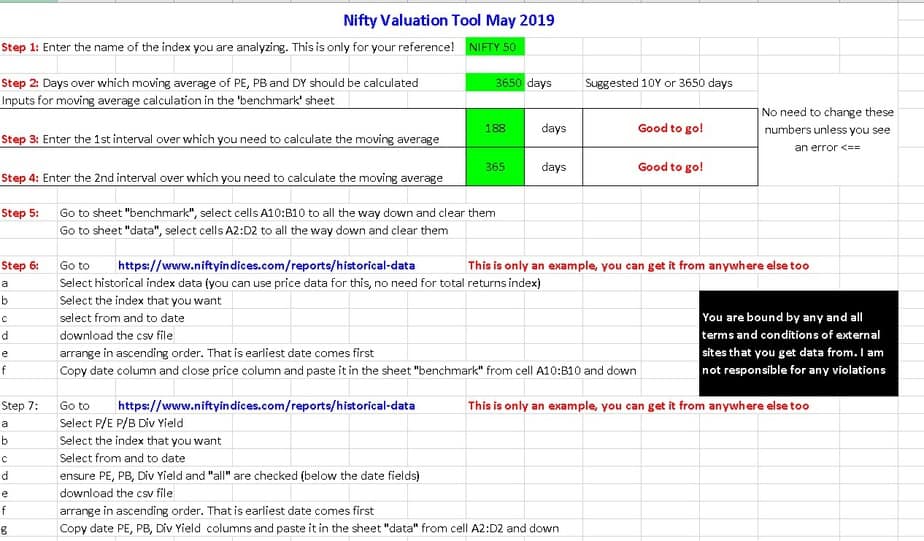
Nifty Valuation Tool Instructions Page
The user following the instructions in this page can paste any index data (price, PE, PB, Div Yield) and analyze valuation. Automated data download is not possible/feasible.
Disclaimer: The sheet provided below is informational/educational. It will tell you the results of various indicators but not when to buy, sell, or do anything else. That judgment is entirely up to the user. The sheet has been extensively tested for bugs, and there are no known bugs. However, it is impossible to guarantee that the sheet is free of errors. Users can bring issues to my notice for evaluation. I am not responsible for gains or losses that the user may suffer by using this tool.