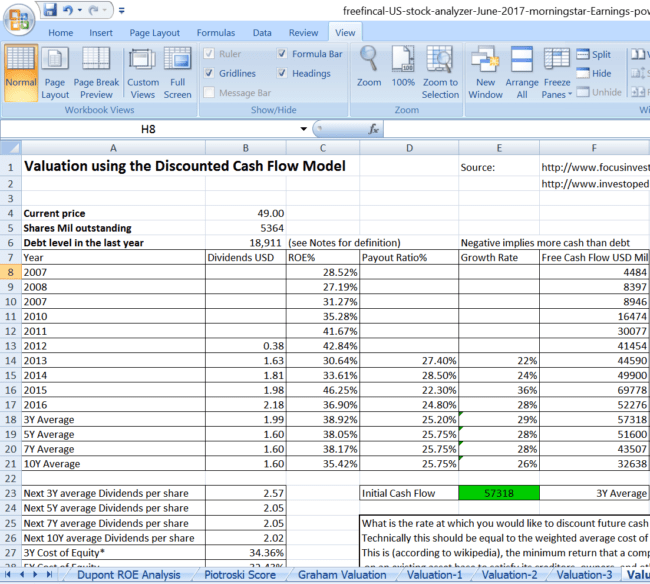
Use this free Excel spreadsheet to analyse and evaluate U.S. stocks listed at the NASDAQ or NYSE. Five valuation model are available, along with Piotroski, Dupont, Altman Z-score and earnings power analysis.
How to use the sheet
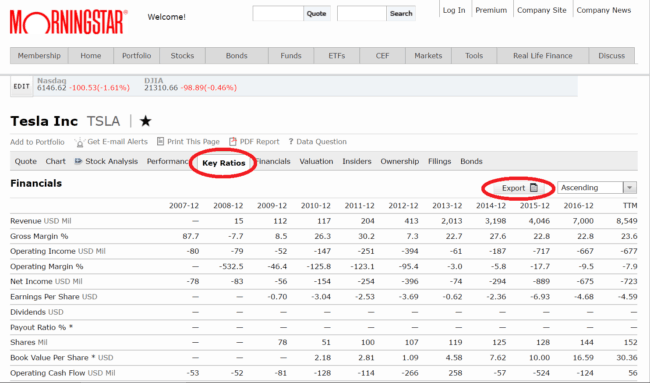
1: Go to Morningstar.com and enter the name of a stock in the top search box
2: Select the stock, and in the stock page, click on Key Ratios tab.
3: Download the financials data.
Join 32,000+ readers and get free money management solutions delivered to your inbox! Subscribe to get posts via email! (Link takes you to our email sign-up form)
🔥Want to create a complete financial plan? Learn goal-based investing? Exclusive access to our DIY tools? Increase your income with your skills? Enjoy massive discounts on our robo-advisory tool & courses! 🔥
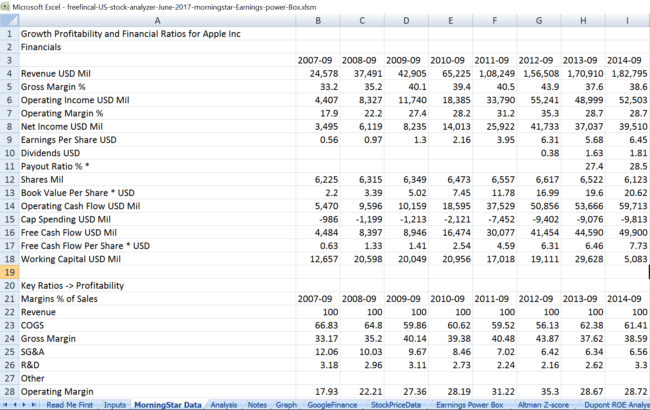
This is how the data sheet looks for Apple Inc.
4: Now open the freefincal stock analyzer (download link below) and follow the steps listed in the inputs page.

This will copy the financials from the morningstar file and the rest of analysis is automated (with the exception of a few subjective inputs).
5: Stock price history can be obtained from Google Finance via a macro. Update: See below
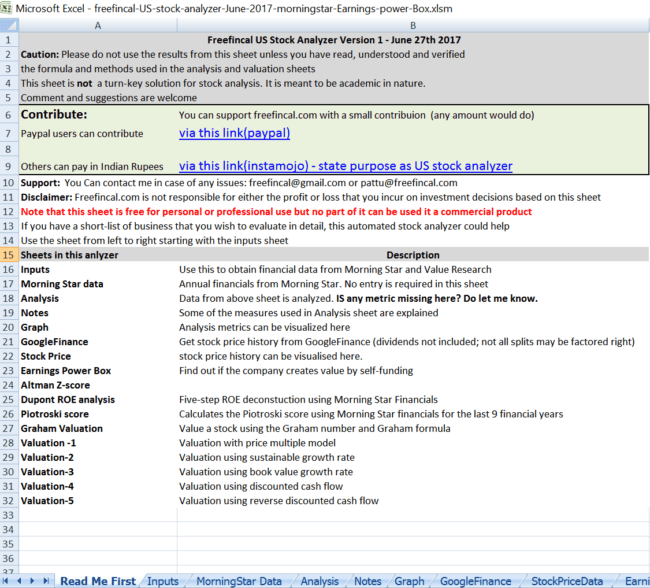
Before we consider each valuation method, the Read me first sheet gives an overview of all features available.
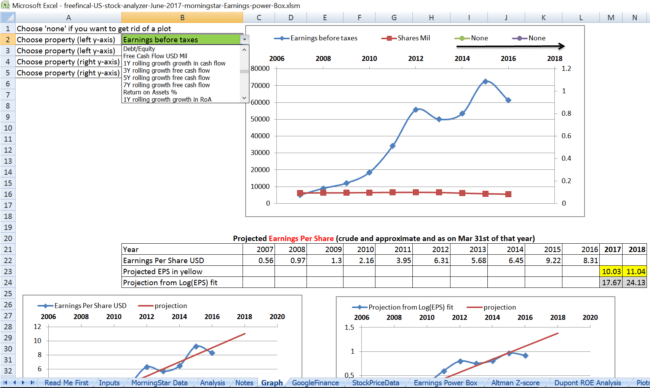
The financial data can be analysed (rolling growth in EPS, operating margin etc.) and visualised via graphs in the Analysis and Graphs sheets.

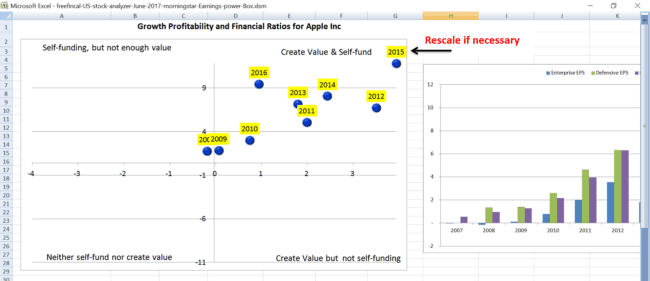
Earnings Power Box
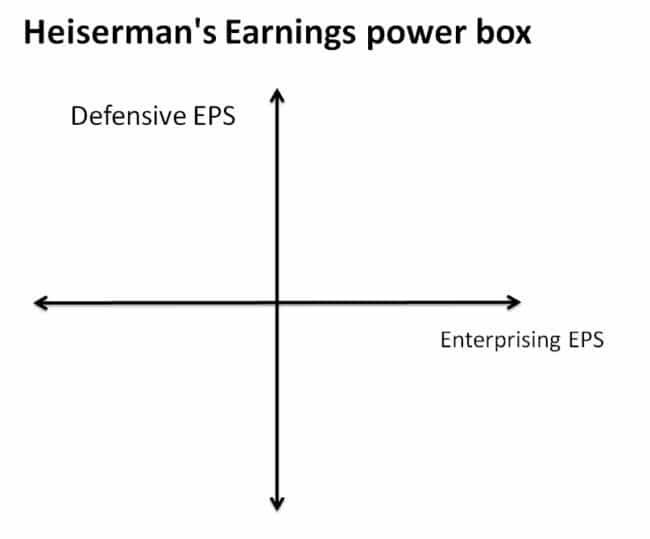
This is a plot of two the Defensive EPS (earnings per share) vs Enterprising EPS
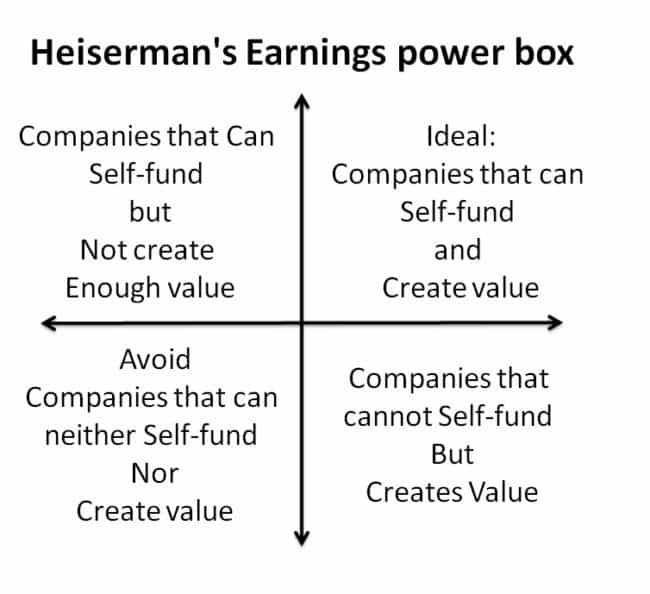
The idea is to spot where a company falls in.
This is based on: Earnings Power Valuation Model
Enterprising EPS = (Enterprising Income)/(Shares Outstanding)
Defensive EPS = (Defensive Income)/(Shares Outstanding)
Enterprising Income = Net Income – (15% x total capital)
15% here is the weighted average cost of capital (WACC) and is an expected return. You can modify this for each FY and for each stock.
15% x total capital = enterprising interest.
Defensive Income = Free Cash Flow – change in working capital since last FY.
Please read more about these assumptions here:
It’s Earnings That Count: Forget the next Infy; Can you identify the next Satyam? (Infy is an Indian mutli-bagger and Satyam a company caught in scams)
and here: Pros & Cons of Finding Stocks with Earnings Power for Long-Term Profits
Earnings power box for Apple Inc.
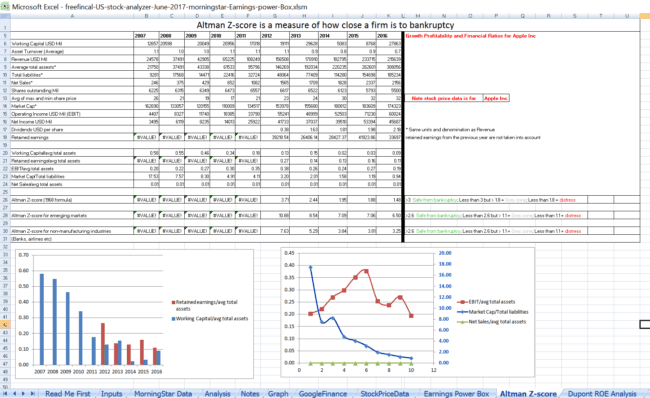
Altman Z-score analysis
The Z-score is a measure of financial health and in particular, how close the business is to bankruptcy.
The Z-score is the weighted sum of 5 ratios. The analyzer can be used to study the historical values of these ratios for the last nine financial years. The ratios are referred to as X1, X2, X3, X4, X5
X1: Working Capital / Total Assets
Working capital is a measure of liquidity and how much cash the business has to pay current obligations. While the working capital can be temporarily negative, a sustained negative trend over time could indicate trouble.
X2: Retained Earnings / Total Assets
If a company has high retained earnings, it is retaining cash for operations instead of paying out dividends. Higher this ratio, lower the reliance on borrowing and debt.
X3: EBIT / Total Assets
EBIT is the earnings before interest payments and tax. So this is a measure of profitability. Altman refers to this as a “true measure of productivity”.
X4: Market Value (cap) of Equity / Total Liabilities
Any dramatic drop in this ratio is a sign of poor financial health.
X5: Net Sales/ Total Assets
Also known as the capital turnover ratio, this is a measure of ability to generate sales and also steer clear of competition.
The Altman Z-score is measured by multiplying each of these ratios by a factor and adding them up.
Z (1968 version) = 1.2X1 + 1.4X2 + 3.3X3 + 0.6X4 + 1.0X5
Automated Return on Equity Analysis with the Dupont Formula
Return on equity is defined as
ROE = Net income/shareholders equity.
It is the profit for each unit of shareholders equity or the earning power of the company. If there is a gradual increase or decrease in ROE, it is beneficial to dig deeper and find out the reasons behind the trend.
Deconstructing the ROE into multiple factors helps us understand the factors that drive the ROE change. This was first doneOpens in a new window by DuPont explosives salesman Donaldson Brown in 1912 and hence the name Dupont formula.
In its modern form, the ROE is written as a product of five ratios.
Thus the ROE is the product of
- Financial leverage
- asset turnover
- operating margin
- interest burden
- tax burden.
- The financial leverage is a measure of a companies debt. Higher the leverage, higher the borrowing and it could result in an increase in ROE! Therefore, if a fall in ROE is driven by a fall in financial leverage it is probably a good development.
- Asset turnover is a measure of how well assets (including debt) are used to generate profit. An increase in ROE coupled with an increase in asset turnover is desirable. Decreasing asset turnover but steady/increasing revenue could imply the presence of unproductive assets.
- Operating margin can be thought of as the profit left over after paying for production costs. A healthy operating margin is necessary to pay back debt. An increase in financial leverage should soon result in an increase in operating margin!
- Interest burden represents the extent interest that has to be paid out to lenders. When financial leverage increases, interest burden will also increase.
- Tax burden is a measure of the taxes that has to be paid. When interest burden increases, tax burden will usually decrease.
As with all financial ratios and balance sheet entries, these are heavily industry dependent.
Snapshot of ROE analysis for Apple Inc
Piotroski Score
In January 2002, Prof. Joseph Piotroski wrote a paper titled, Value Investing: The Use of Historical Financial Statement Information to Separate Winners from LosersOpens in a new window which detailed a method of buying stocks based on 9 balance sheet based criterion. It is now known as the Piotroski Score or the Piotroski F- Score. He presented a back-testing study which supported the utility of the method.Value investorsOpens in a new window could have increased their returns by 7.5% if they had used this method 20 years ago.
Here is the list of criteria used to calculate the Piotroski Score. This and the calculation in the sheet is based on Building a Financial ModelOpens in a new window
Piotroski Score Metrics
- Return on Assets (ROA): Net income relative to (divided by) total assets. One point if positive. Zero if negative.
- If this financial years, ROA is greater than previous financial years ROA, one point. Else zero.
- Cash flow return on assets (CFROA): Operating cash flow relative to total assets. One point if positive. Zero if negative.
- If CFROA is greater than ROA, one point. Else zero. This measures the quality of earnings.
- Leverage = long-term debt relative to total assets. If leverage has decreased this financial year, one point, else zero.
- Liquidity. The Current ratio is current assets divided by current liabilities. One point if last reported current ratio is greater than that for the previous financial years. Else zero.
- One point if the shares outstanding has remained the same or decreased. Else zero.
- Asset turnover: Total sales relative to total assets. One point if this is higher than that for the previous financial year. Else zero.
- Gross margin: Gross profit relative to sales. One point if higher than that for the previous financial year.
With these metrics a company can be given a Piotroski Score. Higher the score, better the strength of the company and confidence in its operation.
This is the calculation for Apple INC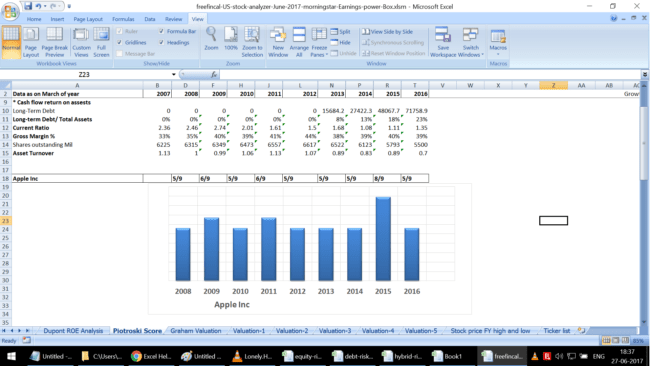
Valuation Models Available (click links for details)
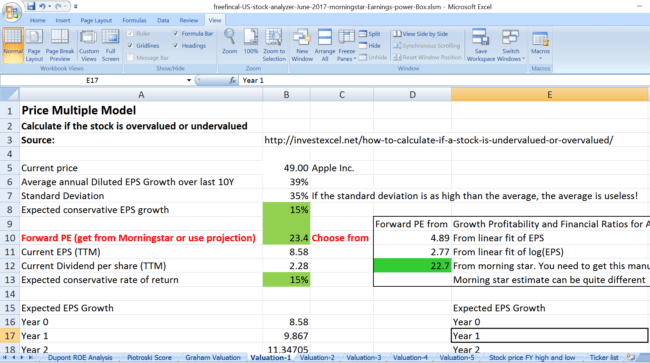
1) Price Multiple Model
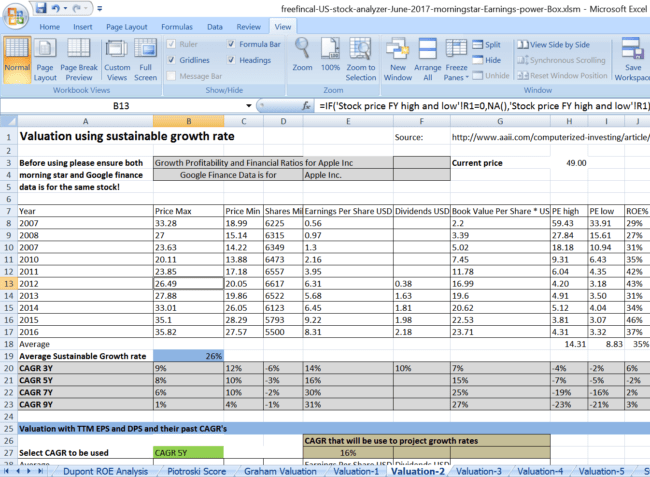
2) Sustainable Growth Rate
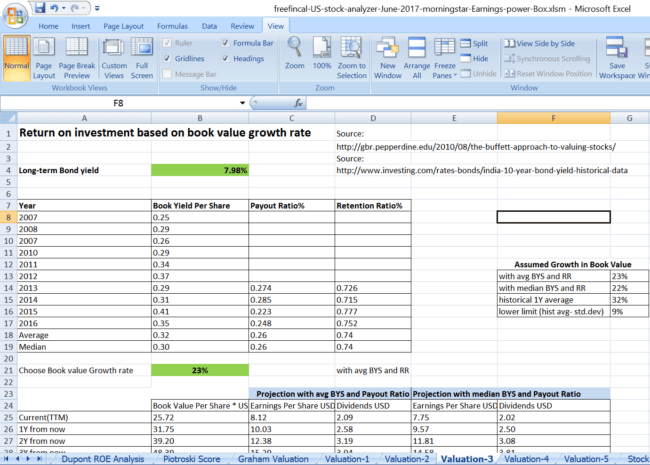
3) Book Value Growth Rate (Buffett’s approach to valuation)
4) Discounted Cash Flow (DCF)
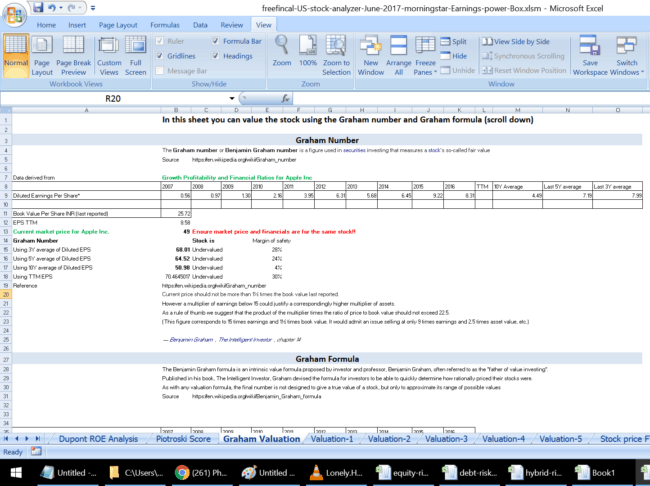
6) Graham formula and Graham number
7) Earnings Growth Estimate
Other Screenshots
Download Link
The tool is currently being modified.
🔥Enjoy massive discounts on our courses, robo-advisory tool and exclusive investor circle! 🔥& join our community of 7000+ users!
Use our Robo-advisory Tool for a start-to-finish financial plan! ⇐ More than 2,500 investors and advisors use this!
Track your mutual funds and stock investments with this Google Sheet!
We also publish monthly equity mutual funds, debt and hybrid mutual funds, index funds and ETF screeners and momentum, low-volatility stock screeners.


- Do you have a comment about the above article? Reach out to us on Twitter: @freefincal or @pattufreefincal
- Have a question? Subscribe to our newsletter using the form below.
- Hit 'reply' to any email from us! We do not offer personalized investment advice. We can write a detailed article without mentioning your name if you have a generic question.
Join 32,000+ readers and get free money management solutions delivered to your inbox! Subscribe to get posts via email! (Link takes you to our email sign-up form)
About The Author
 Dr M. Pattabiraman(PhD) is the founder, managing editor and primary author of freefincal. He is an associate professor at the Indian Institute of Technology, Madras. He has over ten years of experience publishing news analysis, research and financial product development. Connect with him via Twitter(X), Linkedin, or YouTube. Pattabiraman has co-authored three print books: (1) You can be rich too with goal-based investing (CNBC TV18) for DIY investors. (2) Gamechanger for young earners. (3) Chinchu Gets a Superpower! for kids. He has also written seven other free e-books on various money management topics. He is a patron and co-founder of “Fee-only India,” an organisation promoting unbiased, commission-free investment advice.
Our flagship course! Learn to manage your portfolio like a pro to achieve your goals regardless of market conditions! ⇐ More than 3,000 investors and advisors are part of our exclusive community! Get clarity on how to plan for your goals and achieve the necessary corpus no matter the market condition is!! Watch the first lecture for free! One-time payment! No recurring fees! Life-long access to videos! Reduce fear, uncertainty and doubt while investing! Learn how to plan for your goals before and after retirement with confidence.
Our new course! Increase your income by getting people to pay for your skills! ⇐ More than 700 salaried employees, entrepreneurs and financial advisors are part of our exclusive community! Learn how to get people to pay for your skills! Whether you are a professional or small business owner who wants more clients via online visibility or a salaried person wanting a side income or passive income, we will show you how to achieve this by showcasing your skills and building a community that trusts and pays you! (watch 1st lecture for free). One-time payment! No recurring fees! Life-long access to videos!
Our new book for kids: “Chinchu Gets a Superpower!” is now available!


Must-read book even for adults! This is something that every parent should teach their kids right from their young age. The importance of money management and decision making based on their wants and needs. Very nicely written in simple terms. - Arun.Buy the book: Chinchu gets a superpower for your child!
How to profit from content writing: Our new ebook is for those interested in getting side income via content writing. It is available at a 50% discount for Rs. 500 only!
Do you want to check if the market is overvalued or undervalued? Use our market valuation tool (it will work with any index!), or get the Tactical Buy/Sell timing tool!
We publish monthly mutual fund screeners and momentum, low-volatility stock screeners.
About freefincal & its content policy. Freefincal is a News Media Organization dedicated to providing original analysis, reports, reviews and insights on mutual funds, stocks, investing, retirement and personal finance developments. We do so without conflict of interest and bias. Follow us on Google News. Freefincal serves more than three million readers a year (5 million page views) with articles based only on factual information and detailed analysis by its authors. All statements made will be verified with credible and knowledgeable sources before publication. Freefincal does not publish paid articles, promotions, PR, satire or opinions without data. All opinions will be inferences backed by verifiable, reproducible evidence/data. Contact information: To get in touch, use this contact form. (Sponsored posts or paid collaborations will not be entertained.)
Connect with us on social media
- Twitter @freefincal
- Subscribe to our YouTube Videos
- Posts feed via Feedburner.
Our publications
You Can Be Rich Too with Goal-Based Investing
 Published by CNBC TV18, this book is meant to help you ask the right questions and seek the correct answers, and since it comes with nine online calculators, you can also create custom solutions for your lifestyle! Get it now.
Gamechanger: Forget Startups, Join Corporate & Still Live the Rich Life You Want
 This book is meant for young earners to get their basics right from day one! It will also help you travel to exotic places at a low cost! Get it or gift it to a young earner.
Your Ultimate Guide to Travel
 This is an in-depth dive into vacation planning, finding cheap flights, budget accommodation, what to do when travelling, and how travelling slowly is better financially and psychologically, with links to the web pages and hand-holding at every step. Get the pdf for Rs 300 (instant download)