
Last Updated on April 26, 2025 at 9:23 pm
Here are 50 stocks with excellent earnings power track record. Based on Hewitt Heiserman Jr.’s Earnings Power Box, these companies have the potential to self-fund and create value. You can download a free tool to analyze any stock of your choice. This excellent compilation has been put together by Lokesh Verma based on Automated Stock Analysis with the Earnings Power Box.
Update: This tool is now part of the freefincal investor circle.
Disclaimer: The data presented below is for informational purposes only and should not be construed as investment advice. Please do your own research before investing. Neither Lokesh Varma nor I will be responsible for your losses or gains. Please take some time to read and understand the Pros & Cons of Finding Stocks with Earnings Power for Long-Term Profits before proceeding further.
What is Hewitt Heiserman Jr.’s Earnings Power Box?
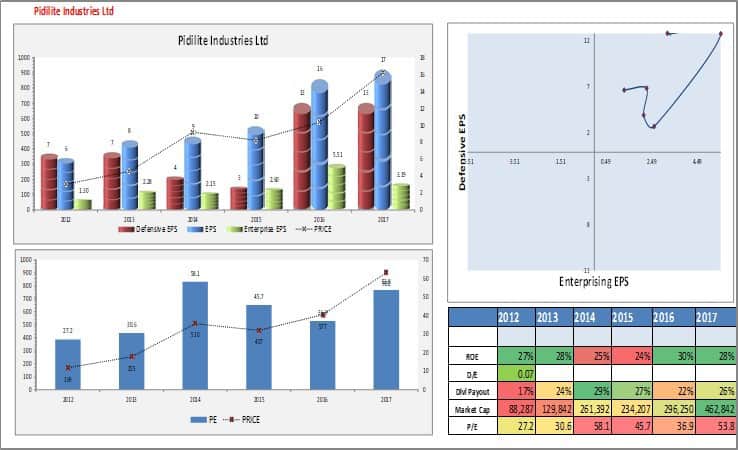
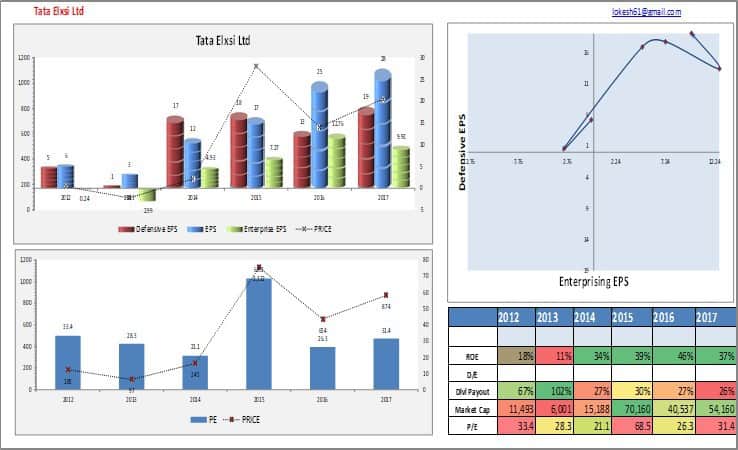
This is a plot of two the Defensive EPS (earnings per share) vs Enterprising EPS
🔥Secure your future with our Robo-advisory tool trusted by over 3,500 investors and advisors. From effortless retirement planning to funding your children’s biggest dreams, turn your financial goals into reality. 🔥
Subscribe for money management solutions via email! (Link takes you to our email sign-up form) Join 32,000+ readers in our community.
👉 New Tool Alert! NaviPlan: A Privacy-Focused Multi-asset Tracker and Goal Planner 👈

The idea is to spot where a company falls in.
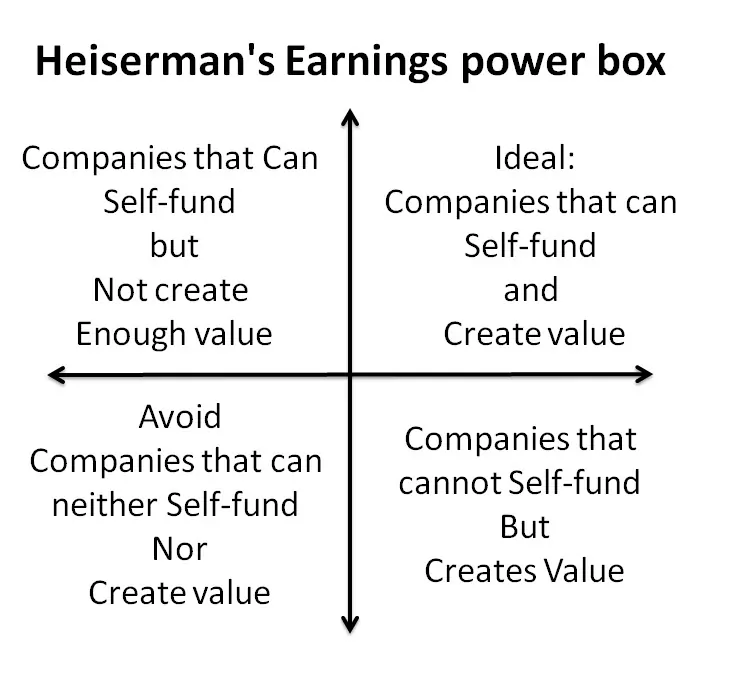
This is based on: Earnings Power Valuation Model (doc file) and it was developed into an Excel calculator by Rs. Srivatsan. His guest post is a good starting point to understand the idea: It’s Earnings That Count: Forget the next Infy; Can you identify the next Satyam? Srivatsan has defined enterprising and defensive EPS as follows: Enterprising EPS = (Enterprising Income)/(Shares Outstanding) and Defensive EPS = (Defensive Income)/(Shares Outstanding). Therefore,
Enterprising Income = Net Income – (15% x total capital). Here 15% is the weighted average cost of capital (WACC) and is an expected return. Also, 15% x total capital = enterprising interest.
Defensive Income = Free Cash Flow – change in working capital since last FY.
About Lokesh
The process to identify 50 stocks with solid earnings power
Many thanks for reaching out. I draw great inspiration from your work and happy to share with investor community with my little bit. As discussed, please find the attached list and its related 50 graphs.
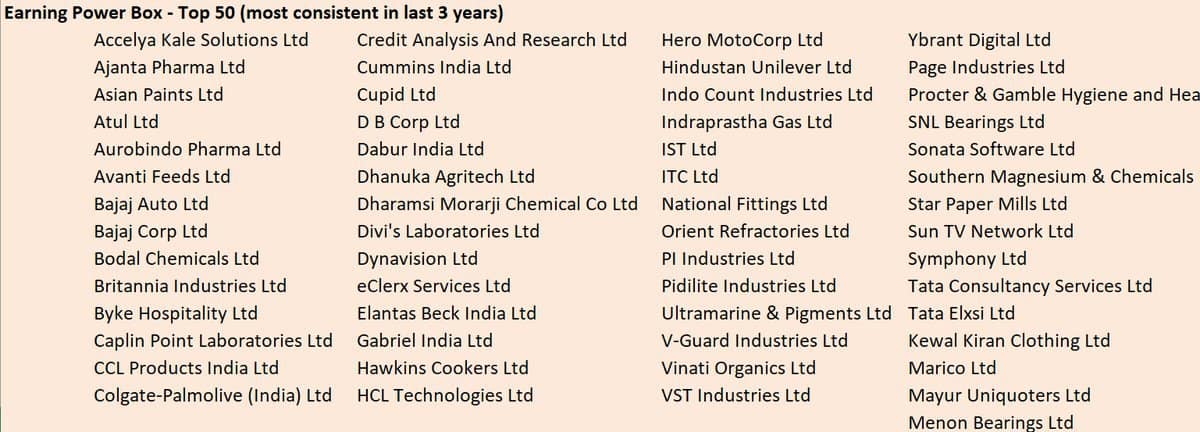
The 50 stocks with impressive earning power record
| Accelya Kale Solutions Ltd |
| Ajanta Pharma Ltd |
| Asian Paints Ltd |
| Atul Ltd |
| Aurobindo Pharma Ltd |
| Avanti Feeds Ltd |
| Bajaj Auto Ltd |
| Bajaj Corp Ltd |
| Bodal Chemicals Ltd |
| Britannia Industries Ltd |
| Byke Hospitality Ltd |
| Caplin Point Laboratories Ltd |
| CCL Products India Ltd |
| Colgate-Palmolive (India) Ltd |
| Credit Analysis And Research Ltd |
| Cummins India Ltd |
| Cupid Ltd |
| D B Corp Ltd |
| Dabur India Ltd |
| Dhanuka Agritech Ltd |
| Dharamsi Morarji Chemical Co Ltd |
| Divi’s Laboratories Ltd |
| Dynavision Ltd |
| eClerx Services Ltd |
| Elantas Beck India Ltd |
| Gabriel India Ltd |
| Hawkins Cookers Ltd |
| HCL Technologies Ltd |
| Hero MotoCorp Ltd |
| Hindustan Unilever Ltd |
| Indo Count Industries Ltd |
| Indraprastha Gas Ltd |
| IST Ltd |
| ITC Ltd |
| National Fittings Ltd |
| Orient Refractories Ltd |
| PI Industries Ltd |
| Pidilite Industries Ltd |
| Ultramarine & Pigments Ltd |
| V-Guard Industries Ltd |
| Vinati Organics Ltd |
| VST Industries Ltd |
| Ybrant Digital Ltd |
| Page Industries Ltd |
| Procter & Gamble Hygiene and Health Care Ltd |
| SNL Bearings Ltd |
| Sonata Software Ltd |
| Southern Magnesium & Chemicals Ltd |
| Star Paper Mills Ltd |
| Sun TV Network Ltd |
| Symphony Ltd |
| Tata Consultancy Services Ltd |
| Tata Elxsi Ltd |
| Kewal Kiran Clothing Ltd |
| Marico Ltd |
| Mayur Uniquoters Ltd |
| Menon Bearings Ltd |
Earnings Power Box graphs for the 50 stocks
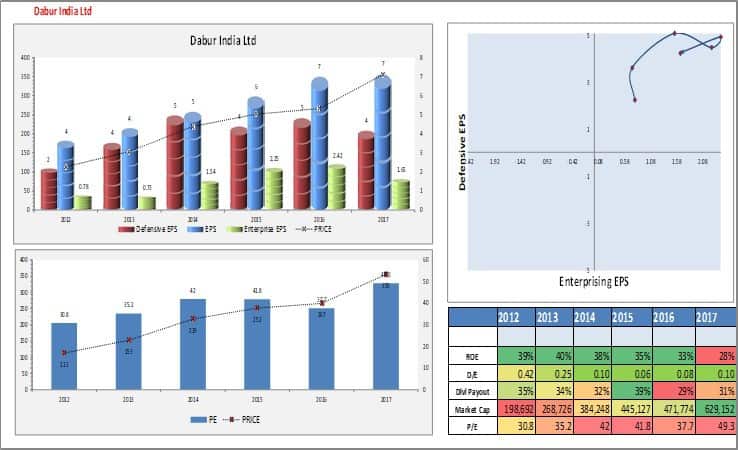
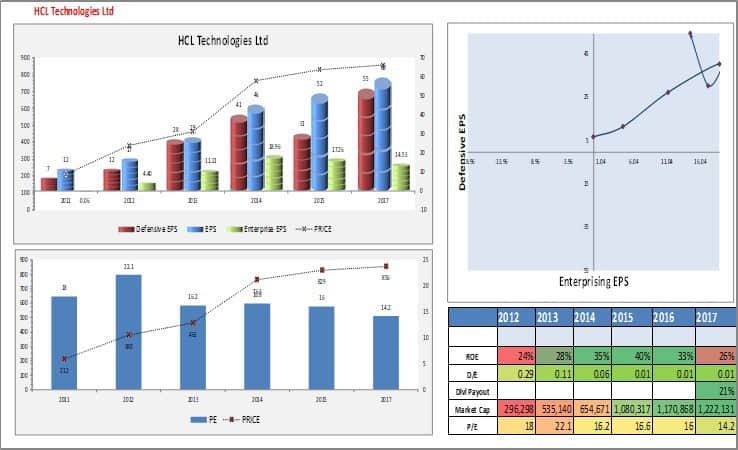
Five graphs are shown below. The rest are available as a slide show.


Download Earning power box analysis tools
This tool is now part of the freefincal investor circle.
Acknowledgements
Lokesh Varma and R. Srivatsan for generously sharing their expertise with all of us. Hewitt Heiserman Jr for a fantastic analytical method. He has used the US version of the above tool and is impressed with it. Kudos to Srivatsan. If you find this useful, please thank Lokesh. A gentle reminder to pay heed to the disclaimer mentioned above.