Last Updated on December 29, 2021 at 5:12 pm
Here is how investors can quickly spot undervalued stocks using Morningstar’s Quantitative Equity Ratings. A look at the features of the tool. According to Morningstar, these ratings are based on a machine-learning based forward-looking statistical model with four parameters: Moat, Valuation, Uncertainty and Financial Health. A non-technical version of the rating method is also available.
Quantitative Valuation
This is a ratio of the fair value estimated with discounted cash flows (DCF) and its current market price. The rating is expressed as Overvalued, Fairly Valued, and Undervalued. Those interested in exploring this method can use this tool Automated Stock Analyzer with Discounted Cash Flow Valuation. The main problem with any valuation method is analyst inputs. These are crucial to the result and is based on a qualitative perception of risk and reward in a particular industry. So it will be arbitrary. Morningstar’s approach is explained in Appendix B of this MorningStar Methodology Paper
Quantitative Economic Moat
A moat is a trench surrounding a castle to prevent attacks. Wider the moat, safer the castle. Warren Buffett used this term to identify the competition a particular company has in a sector. A moat is a measure of sustainable competitive advantage. According to Morningstar,
We assign one of three Morningstar® Economic Moat™ Ratings: none, narrow, or wide. There are two major requirements for firms to earn either a narrow or wide rating: 1. The prospect of earning above-average returns on capital; and 2. Some competitive edge that prevents these returns from quickly eroding.
The factors used to arrive at the Moat score are described in appendix C of the above-referenced document. MorningStar claims only 10% of all analysed stocks get a wide-moat rating.
🔥Secure your future with our Robo-advisory tool trusted by over 3,500 investors and advisors. From effortless retirement planning to funding your children’s biggest dreams, turn your financial goals into reality. 🔥
Subscribe for money management solutions via email! (Link takes you to our email sign-up form) Join 32,000+ readers in our community.
👉 New Tool Alert! NaviPlan: A Privacy-Focused Multi-asset Tracker and Goal Planner 👈
Quantitative Financial Health
This is a measure of financial distress or how well a company will meet its financial obligations and is expressed as Weak, Moderate, and Strong.
Quantitative Uncertainty
This takes into account future possible outcomes of the companies share price. It is possible for it to fluctuate wildly due to its proposed activities and how they will be received? Or will it be stable as it is a well-established player? The rating is expressed as Low, Medium, High, Very High, and Extreme. A low rating implies a more stable return (possibly low) and higher rating implies higher risk-reward and requires a greater margin of safety in valuation.
This short video summarises how the above parameters are used to rate a stock by MorningStar
Sample Results (as on 14th Nov 2019)
- Head over to the Quantitative Rating Page
- Select the moat, valuation, uncertainty and financial health filters to shortlist stocks.
This is a screenshot.
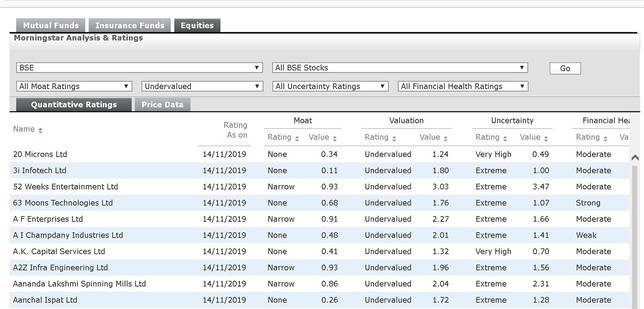
- As many as 2433 stocks are undervalued as on 14th Nov 2019 with no other filters set.
- Out of these, only 487 have strong financial health
- No stock has low uncertainty (that is a possibility of stable return)
- Wipro is the only undervalued stock with strong financial health, medium uncertainty but with a narrow moat
- 22 stocks have high uncertainty, strong financial health and undervalued
- ITC is the only undervalued stock with a wide moat; strong financial health; but strong uncertainty
- Only 31 stocks have a wide moat with no other filters
- Out of these, only Bajaj Finance Ltd and HDFC Bank Ltd (!) and HDFC Bank Ltd are fairly priced
- Only Alkem Laboratories Ltd has a low uncertainty rating with strong financial health and narrow moat but is overvalued.
After an initial shortlist, deeper analysis with the earnings power box tool and further checks as mentioned in this Wikipedia article is recommended.
Additional Resources
- Nifty Valuation Tool: Find out if the stock market is expensive or cheap in multiple ways
- Valuation sandbox: Analyze a stock in multiple ways with MorningStar Data
- How new stock investors can quickly start investing using NIFTY Multi-Factor Indices
- How to calculate annualized return (XIRR) from a stock investment
- Momentum, Low Volatility Stock Screener (Nov 2019)
- These are the most popular and least popular stocks held by mutual funds (Sep 2019)