Last Updated on December 29, 2021 at 12:13 pm
Suppose you have a SIP running in a mutual fund. Your friend starts a SIP in the same fund six months later. After 2-3 years you compare returns and are shocked to see a huge difference. That is capital markets for you. We explain why this occurs with a detailed example and what we can do about it. This post is an extended analysis of a previous study: The Blind Men and the Mutual Fund!
The main purpose of this article is to point out that it is incorrect to expect any target return from a SIP or a mutual fund investment over any duration. The volatility in returns is too high. While we shall consider DSP Small Cap fund and a five-year duration in this study, the results do not change for any other category (see large cap example in the above link) and for any duration: Dollar Cost Averaging aka SIP analysis of S&P 500 and BSE Sensex. It is important to keep in mind that Indian markets are quite young and there are not enough periods to study 15, 20,25,30 year periods. The range of returns observed in long-term studies is small not because the duration is long enough but because there are not enough data points. It is important to never forget this.
Example one: 15 SIPS started a month apart and compared on the same date
🔥Secure your future with our Robo-advisory tool trusted by over 3,500 investors and advisors. From effortless retirement planning to funding your children’s biggest dreams, turn your financial goals into reality. 🔥
Subscribe for money management solutions via email! (Link takes you to our email sign-up form) Join 32,000+ readers in our community.
👉 New Tool Alert! NaviPlan: A Privacy-Focused Multi-asset Tracker and Goal Planner 👈
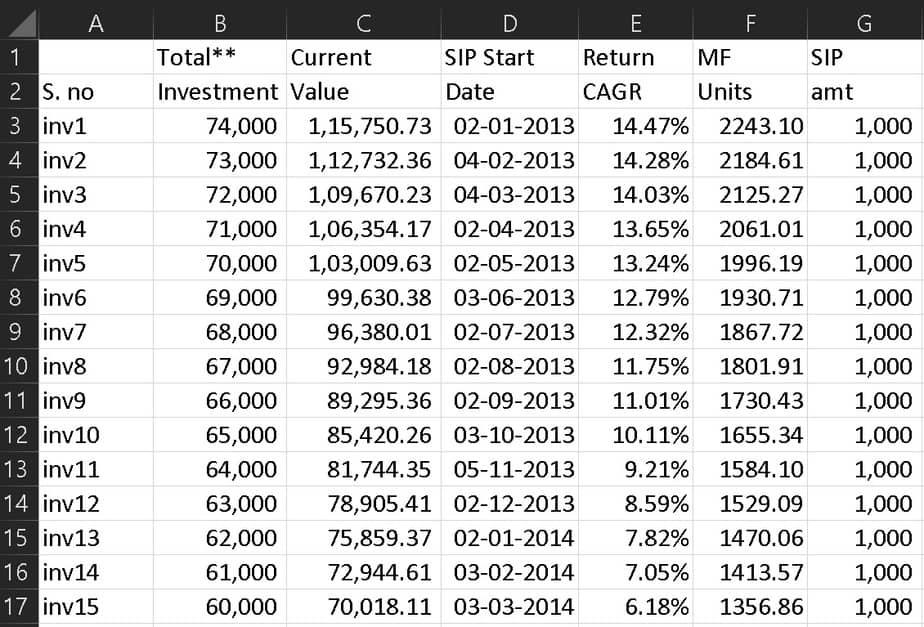
Let us consider 15 SIPs in DSP Small Cap (Micro Cap) Fund started between Jan 2013 and April 2014 one month apart and compare the returns in Feb 2019 (the analysis was done then. Essential results will be similar regardless of the end date). We tabulate the total investment made, current value and returns below. Notice that each successive SIP has a lower return. In fact, the last two SIPs have about half the return of the first two! We refer to this as a sequence of returns risk or timing luck. It means that when you start the SIP matters!
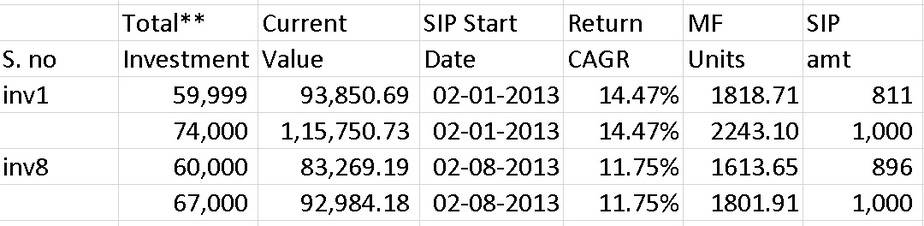
You might say the investment durations are a bit different and therefore the amounts invested and this could change the returns. Not quite. You can see from the picture below that two different SIP amounts over the same duration results in different investment values but the same return. Here, by CAGR, I refer to XIRR. If you do not know the difference, please consult: CAGR vs XIRR: Understanding Annualized Return
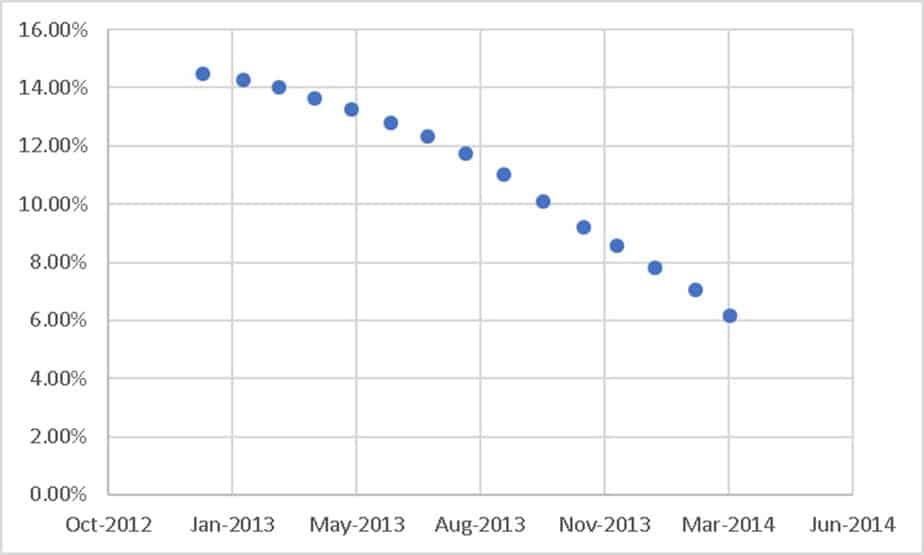
This is how the returns change as the SIP start month changes. Naturally, we are only looking at a small slice of history. We shall expand this below.
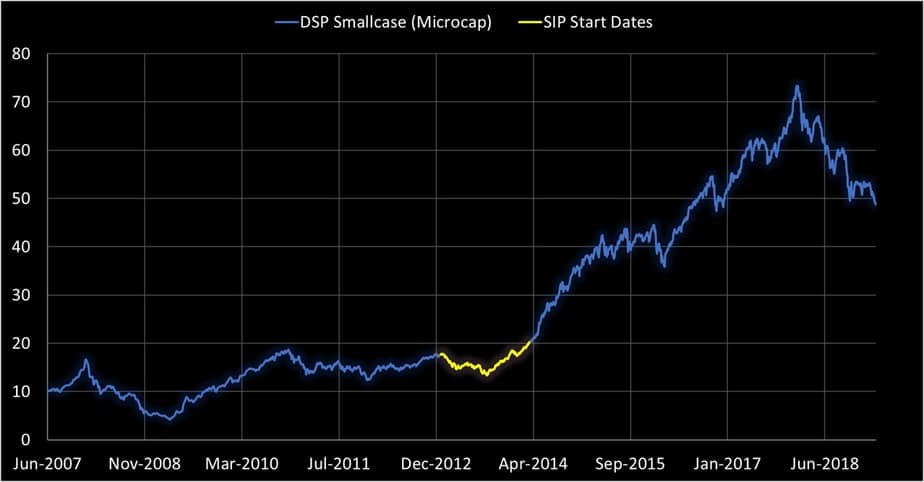
Net we show the 15-month window during which the SIPs were started. It should be immediately clear why the returns are falling. This is again a clear demonstration of the fact that SIPs do not reduce risk or enhance returns!
Lesson from Example one ” When you start investing matters
Example two: 15 SIPS started a month apart and compared a month apart
Instead of comparing the SIPs on the same date, we could do a rolling return analysis. That is the duration is the same = five years and both start and end dates are spaced one month apart as shown below. Notice that the spread in returns here is 6X!!
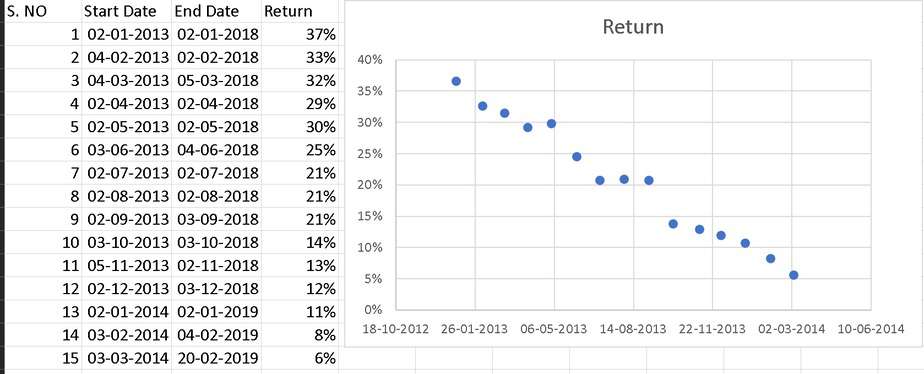
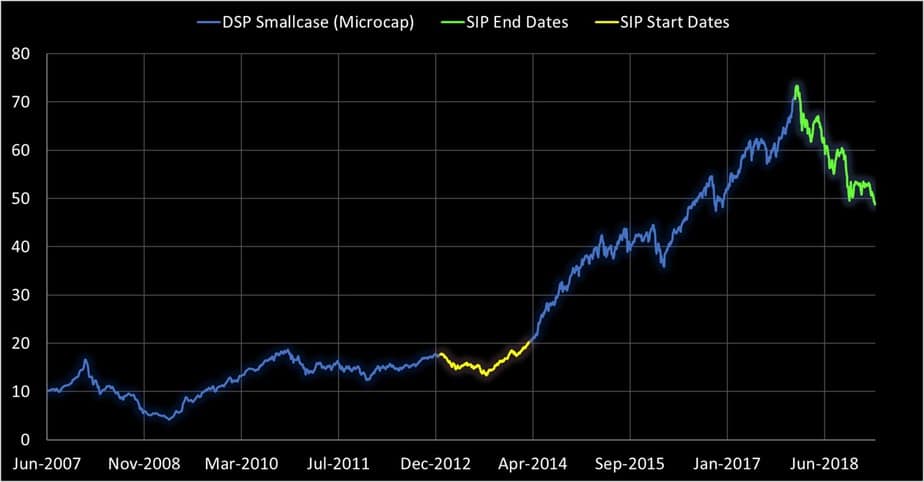
It should immediately be clear why there is such a huge difference in return between the 1st SIP and the 15th SIP!
Lesson from Example two” When you start investing matters and when you finish investing also matters
Full rolling SIP returns data (5Y) for DSP Small Cap Fund
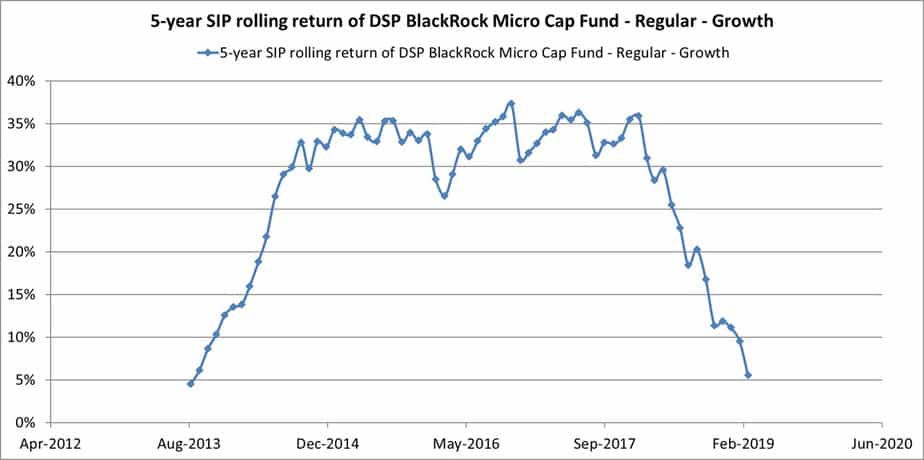
Lesson: Expect nothing from a mutual fund investment !
What is the solution then?
Do not have a target return. Have a target corpus based on a clear goal, a clear asset allocation (that changes with time) and stick to it. As shown in this study: How to reduce risk in an investment portfolio – it works, no matter what the sequence of returns is! Even more efficient methods before and after retirement are discussed in the goal-based portfolio management lectures.
SIP = systematic investing. Meaning there should be a system in place. Investing each month on the same day is automation. Not a system, not a plan. Wake up and smell the coffee!
Also see: Do not expect returns from mutual fund SIPs! Do this instead! (see video below)