Last Updated on August 22, 2022 at 11:15 pm
Readers may recall that we reported Ten-year Nifty SIP returns have reduced by almost 50% in Jan 2020. In this performance report, we look at lump sum and SIP returns of Nifty Next 50, compare it with Nifty and Nifty Midcap 150 and discuss what investors need to appreciate before investing in these indices.
The featured image above shows 570 15-year lump sum returns of the Nifty Next 50. Notice the dramatic drop in return for a 15-Y period ending early 2018 and another ending early 2020. This is how the performance compares with Nifty 50 (all indices are total return, including dividends).

This is a fairly short window but it would be best for an investor to tone down their expectations from Nifty Next 50 (NN50). Nifty Midcap 150 although referenced above is not featured due to lack of history!
🔥Secure your future with our Robo-advisory tool trusted by over 3,500 investors and advisors. From effortless retirement planning to funding your children’s biggest dreams, turn your financial goals into reality. 🔥
Subscribe for money management solutions via email! (Link takes you to our email sign-up form) Join 32,000+ readers in our community.
👉 New Tool Alert! NaviPlan: A Privacy-Focused Multi-asset Tracker and Goal Planner 👈
Shown below is the rolling standard deviation. This a measure of volatility (higher is bad) or a measure of how monthly returns over a given period (15Y here) have deviated from the average monthly return.
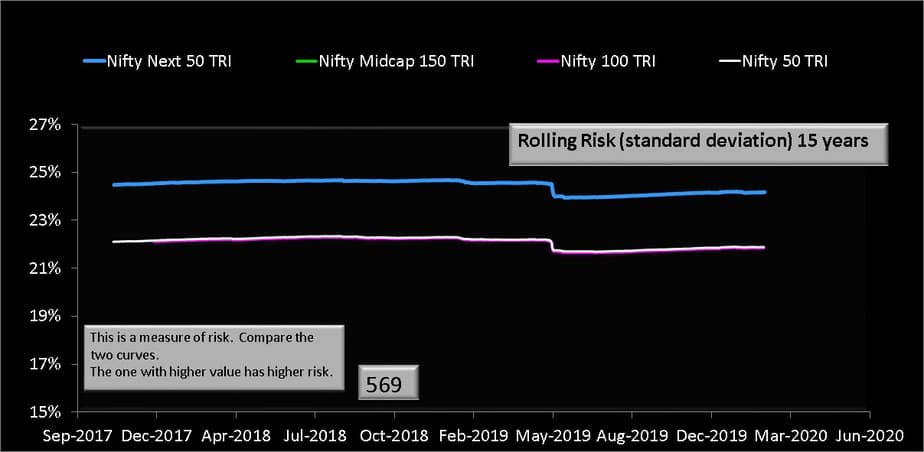
Notice that the volatility of NN50 has been the same but returns have dropped dramatically! For the same risk, the reward has come down. This is an important consideration for investors.
Over ten years, the inspection window increases by more than three times. There are two obvious conclusions. One, NN50 has beaten Nifty and Nifty 100 only during a period when the all segments of the market moved up. During a time when all segments were flat, NN50 is not as rewarding.
As on date, 10Y returns over the last few years for NN50 and NIfty Midcap 150 have been comparable and higher than Nifty or NIfty 100.
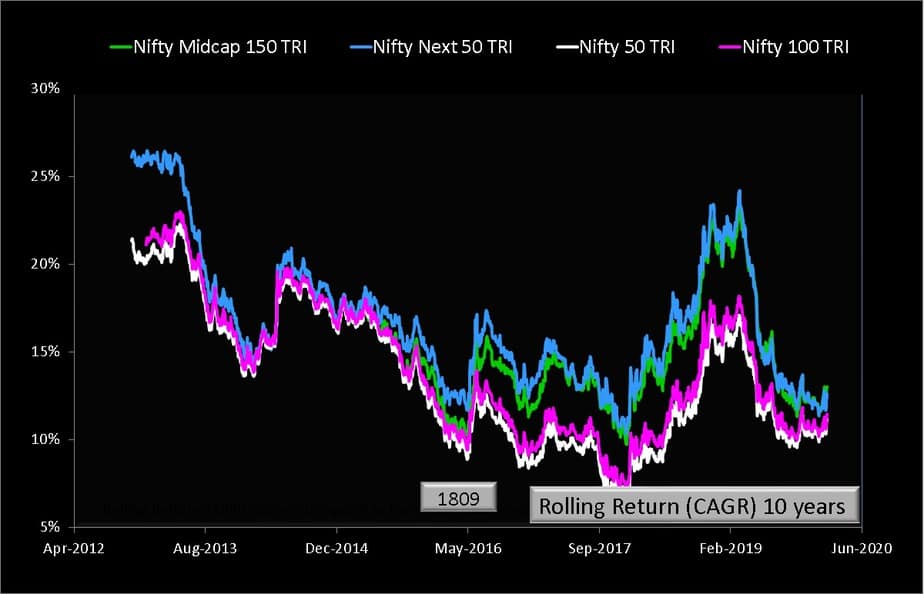
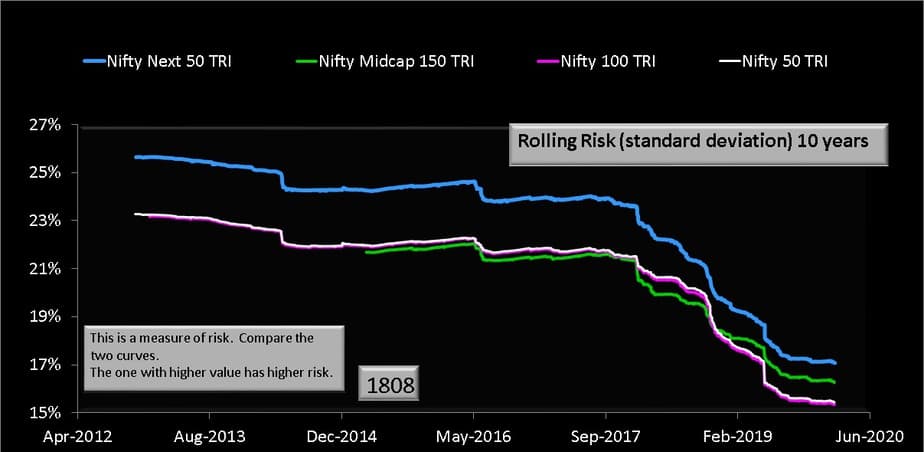
Notice that the 10-year midcap volatility has pulled away from Nifty and moved towards NN50 in recent years. Those investing in Nifty Next 50 index funds are essentially investing in a midcap-like index as noted earlier: Warning! Nifty Next 50 is NOT a large cap index!
Shown next is the 10-year SIP comparison of Nifty and Nifty Next 50. Notice the 50% drop in Nifty SIP returns. We do not have enough history to check but it would be reasonable to expect a similar if not a bigger fall for Nifty Next 50.
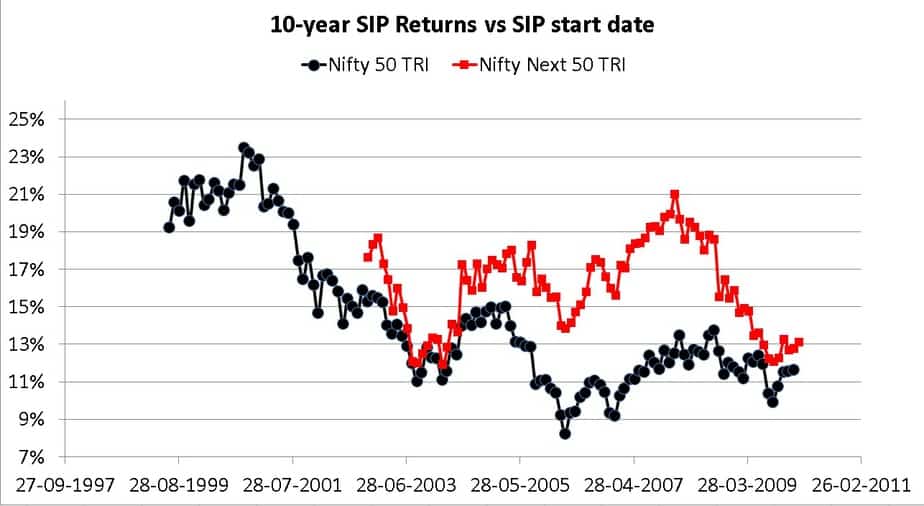
An unmanaged Nifty Next 50 SIP can result in a reward close to a NIfty 50 SIP but with guaranteed higher volatility. Therefore, NN50 investors should at the very least rebalance once a year with NIfty or any other large cap equity holding that they may have.
I think Nifty Next 50 became popular for the wrong reasons: 46% per cent returns in 2017 unmindful of past risk. Inflow into these index funds or ETFs should have decreased since then and is unlikely to increase again if NN50 does not shine as bright as it did in 2017.
The whole problem with the recent increase in passive is that it has come during a period when the indices have zoomed up. Will these passive investors stay put if index funds truly embrace market risk? It remains to be seen. Personally, I will not bet on it.
Aggressive hybrid funds or balanced advantage funds or multi-asset funds or dynamic asset allocation funds can manage risk much better and at least some of them manage to return close to the “market”. The higher expense is justified in this case as the lower volatility is fairly assured. Investors second-guessing their decision to invest in NN50 can consider a move to such funds. Those who wish to stay put with NN50 must have a robust risk management strategy in place.