Last Updated on December 29, 2021 at 4:56 pm
The mutual fund industry has a simple sales mantra. Tell investors not to worry about market volatility because everything will turn out okay in the end! Even the NSE said market volatility is temporary! Thanks to a largely ignorant media, investors are fed on a constant diet of “don’t stop your SIPs if you want to grow wealth”. Sorry, stock market investment risk will never reduce for meaningful “long term” investment durations.
The only way to “build wealth” is to manage risk systematically, not merely invest each month and assume that is enough. See: Myth Busted: SIPs do not reduce risk or enhance returns! Also: Simple Steps to De-risk Your Investment Portfolio and How to systematically reduce the risk associated with a SIP

Even if you are not a sales guy it is quite easy to get fooled by a chart like this, published earlier: Sensex Charts 35 year returns analysis: stock market returns vs risk distribution
🔥Secure your future with our Robo-advisory tool trusted by over 3,500 investors and advisors. From effortless retirement planning to funding your children’s biggest dreams, turn your financial goals into reality. 🔥
Subscribe for money management solutions via email! (Link takes you to our email sign-up form) Join 32,000+ readers in our community.
👉 New Tool Alert! NaviPlan: A Privacy-Focused Multi-asset Tracker and Goal Planner 👈
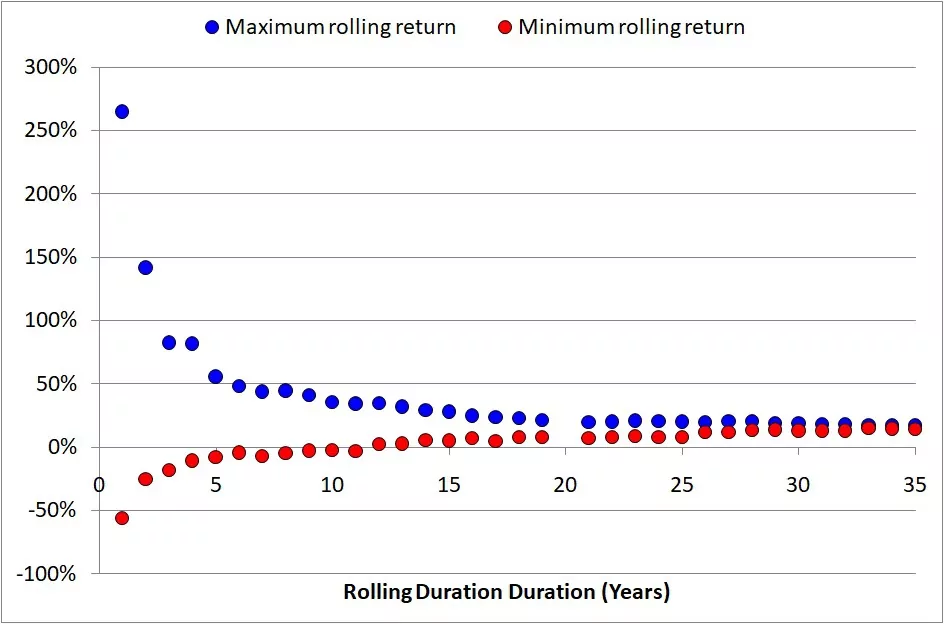
To get this, we look at every possible 5,6,7,…33,34,35 year return period for the Sensex, compute return, pull out and plot the lowest (min) and highest (max) return. This is return spread is a simple way to understand stock market risk. This is an “excellent” graph for a mutual fund distributor to use. Hey, look at that max, and min return lines merge “over the long term”. This is why you should keep your SIPs running.
Recall this quote?
if you torture the data long enough, it will confess to anything
Well, the truth is that you do not need to go into all that trouble. Just reduce the sample size and often you get the result that you want. In this case, the sample size is the available stock market history. We have data only from 1979.
To claim something as dramatic as “stock investment risk reduces with time” we need data going a lot further back in history (assuming we want the truth and not a slide to sell). So let us take a look at S& P 500.
I was able to procure (for a fee) S & P 500 price data from 30th Dec 1927. Hence the above study can be repeated for every possible 1 to 55 years and allows me to better a previous study: Will long-term equity investing always be successful?
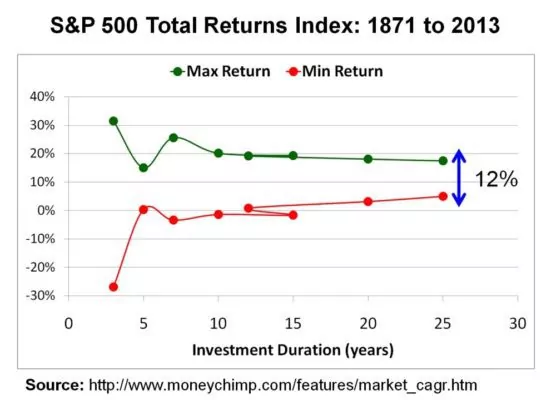
I could not get daily total returns data from 1927, a comparison of the above and below graphs would tell you that it does not matter much. At first sight, you would argue that stock market investment risk does reduce over the long term.
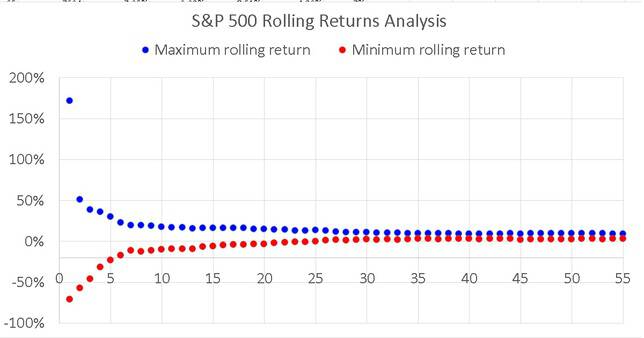
Hang on. Less than 5-year return spreads dominate the graph. So let us get those out of the way. Now, look carefully.

Even with dividends, negative returns are possible up to two decades of investing! Yes, yes, the gap between the max and min returns decreases. However:
- The drop is only from 5 to about 27 years.
- Even at 15, 20, 25 years, the spread in returns is too high. Yes, the risk is lower than say five years, but it is not small enough to blindly keep investing! Ever heard of the saying, “a miss is as good as a mile”?
- Now for the critical observation: Notice that the gap bet max and min returns from years 27 to 55 y is pretty much the same.
Points one and two above should be enough to convince an investor that “long term investing” is not less risky – at least as it is marketed. Point 3 is proof for the unbiased analyst.
Please do not ask “what is the probability of a positive or negative return over the long term?”. Such things cannot be computed. Well, they can be, but it has no meaning.
Also (1), don’t start about the above being lump sum returns and SIP will lower risk. No, it will not. See: Myth Busted: SIPs do not reduce risk or enhance returns!
Also (2), India is not different! We live in an interconnected world. A recession in other countries will spill over to us and dent “long term return expectations”. So the picture shown above for Sensex is likely to change into the one for S & P 500. At the very least, a good risk manager would expect that.
When people read such posts, they assume I am trying to scare people away from equity. I gain nothing from it. I am merely trying to point out that merely dreaming that investing each month will lead to wealth and inflation-beating returns is unfounded. Any portfolio linked to the market must be managed systematically.