Last Updated on December 29, 2021 at 6:14 pm
In this episode of reader-story, Mr G (anonymity on request) discusses his personal financial audit. Thanks to disciplined investing for more than a decade, he has seen his net worth double in the last financial year. It is inspiring to see such meticulous tracking of investments with a long term vision on the future corpus required.
As regular readers may be aware, we publish a personal financial audit each December – this is the 2020 edition: How my retirement portfolio performed in 2020. This time, we asked regular readers to share how they review their investments and track financial goals.
- First audit: How Suhas tracks his MF investments and reviews financial goals.
- Second audit: How Avadhoot Joshi evaluates his investment portfolio.
- Third audit: How a single mom is on track to financial freedom
- Fourth audit: How Gowtham started goal-based investing & took control of his money
- Fifth audit: Why my financial independence & early retirement plans were postponed by four years
- Sixth audit: How Abhisek funded his marriage & is on track to financial freedom.
- Seventh audit: How Rohit’s early struggles defined his investment journey
- Eighth audit: Why my investments are still on track despite job loss and lower-income
- Ninth audit: How a retirement planning calculation scared me to take action
- Tenth audit: I made several investment mistakes but have turned my life around.
- These published audits have had a compounding effect on readers. If you would like to contribute to the DIY community in this manner, send your audits to freefincal AT Gmail. Now over to Mr G.
At the beginning of last financial year, on 1st April 2020, if someone had said that Nifty would further crash to lows of 5000, it would not have been considered an April fools joke. On the other hand, if anyone predicted that markets would touch an all-time high within 7 months, then it definitely would have been considered a cruel joke.
But that’s what exactly happened, in a crazy year that has been FY20-21. The financial year dramatically changed my financial situation, with my networth almost doubling. I never thought I would double my networth in a single year after 11 years into my financial journey. That is the power of equity investing. It also helped that I was disciplined in pumping money into Nifty 50 MF when the markets were crashing, keeping my emotions at bay.
🔥Secure your future with our Robo-advisory tool trusted by over 3,000 investors and advisors. From effortless retirement planning to funding your children’s biggest dreams, turn your financial goals into reality. 🔥
Subscribe for money management solutions via email! (Link takes you to our email sign-up form) Join 32,000+ readers in our community.
👉 New Tool Alert! NaviPlan: A Privacy-Focused Multi-asset Tracker and Goal Planner 👈
I could have invested the money faster. But that is hindsight bias. Who would have thought the market would recover so fast. I also rebalanced my portfolio for the first time, as due to aggressive upward movement in the markets, my equity allocation moved beyond 65%. This year I also set right my asset allocation within equity MF at 70:20:10 for N50:NN50:MidCap Index.
Here is my look back at the year that just went by. For this article, when I say the current year, it means FY20-21 (Apr 2020 to Mar 2021). Next year means FY21-22 (Apr 2021 to Mar 2022), and the previous year means FY19-20 (Apr 2019 to Mar 2020). So let’s begin.
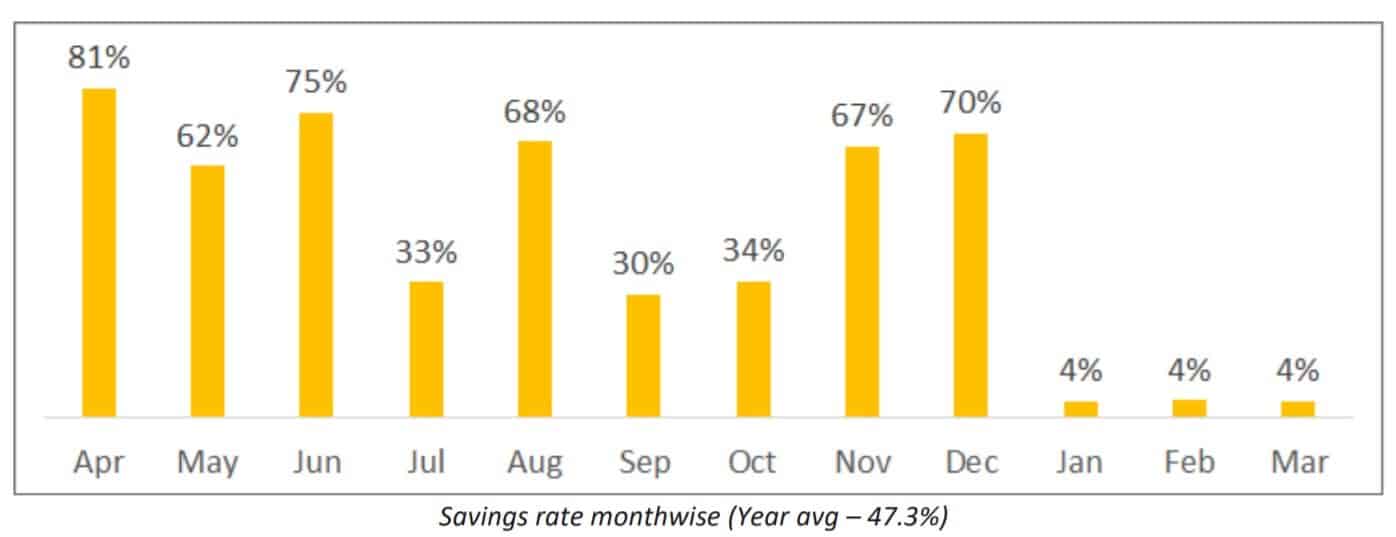
Due to the pandemic and working at home from my hometown, I had a very high savings rate throughout the year. Owing to restrictions, this year, we got a chance to have practical experience in lean living. If not for major house maintenance expenses at the end, average savings would have crossed 50% for the first time. Anyways 47% savings rate is also very good, and I am happy with it.
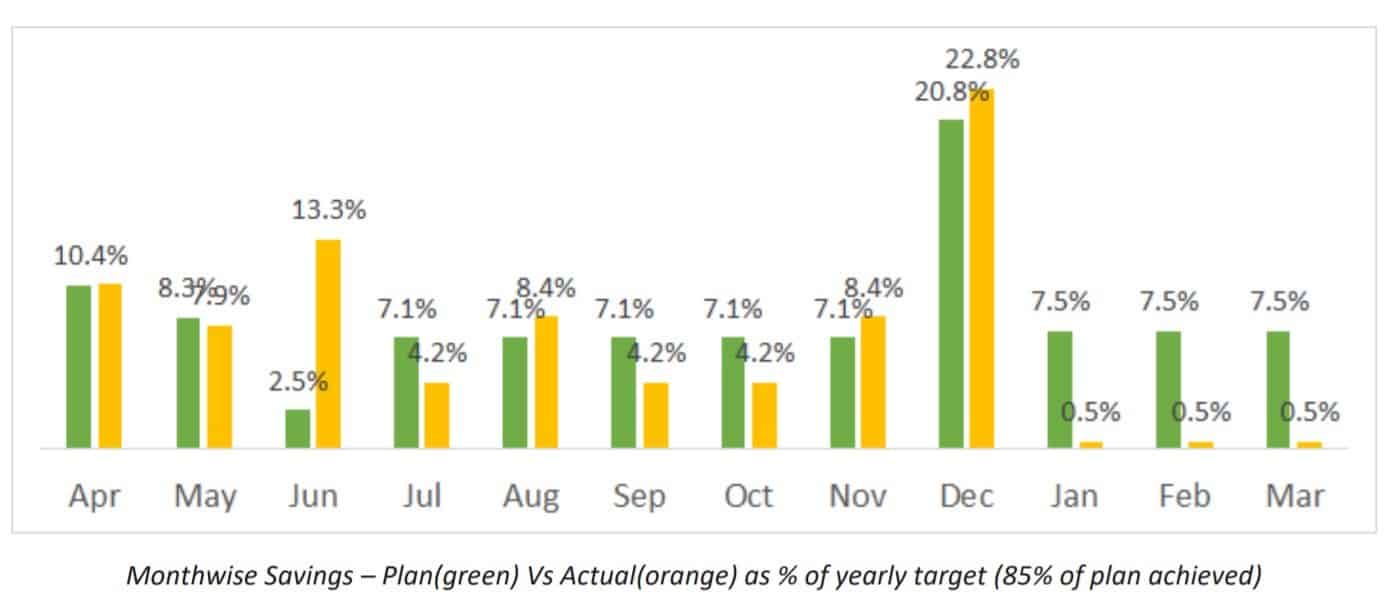
For the past 3 years, I have stopped tracking my expenses and started trying to meet the monthly savings target that I set for myself at the start of the year. I was ahead of the planned savings target till Dec. Though there were significant expenses in the last 3 months, I still managed to achieve 85% of the planned savings.

Oh, what a remarkable year this has been. My gains from investment in this single year are multifold of cumulative gains of last one decade. I almost doubled my networth, with 2/3rd of it coming from gains on investments and not fresh additions. Of course, I ended FY19-20 with a loss, as the market hit bottom right on Mar 31st. But since my equity allocation was less than 40% at that time, the amount of loss was relatively less. Now that I have reached 60% equity allocation, I understand that I am now exposed to the full force of markets, both upside and downside. If a similar crash comes in FY21-22, then the net worth graph will come crashing down as fast as it has gone up.
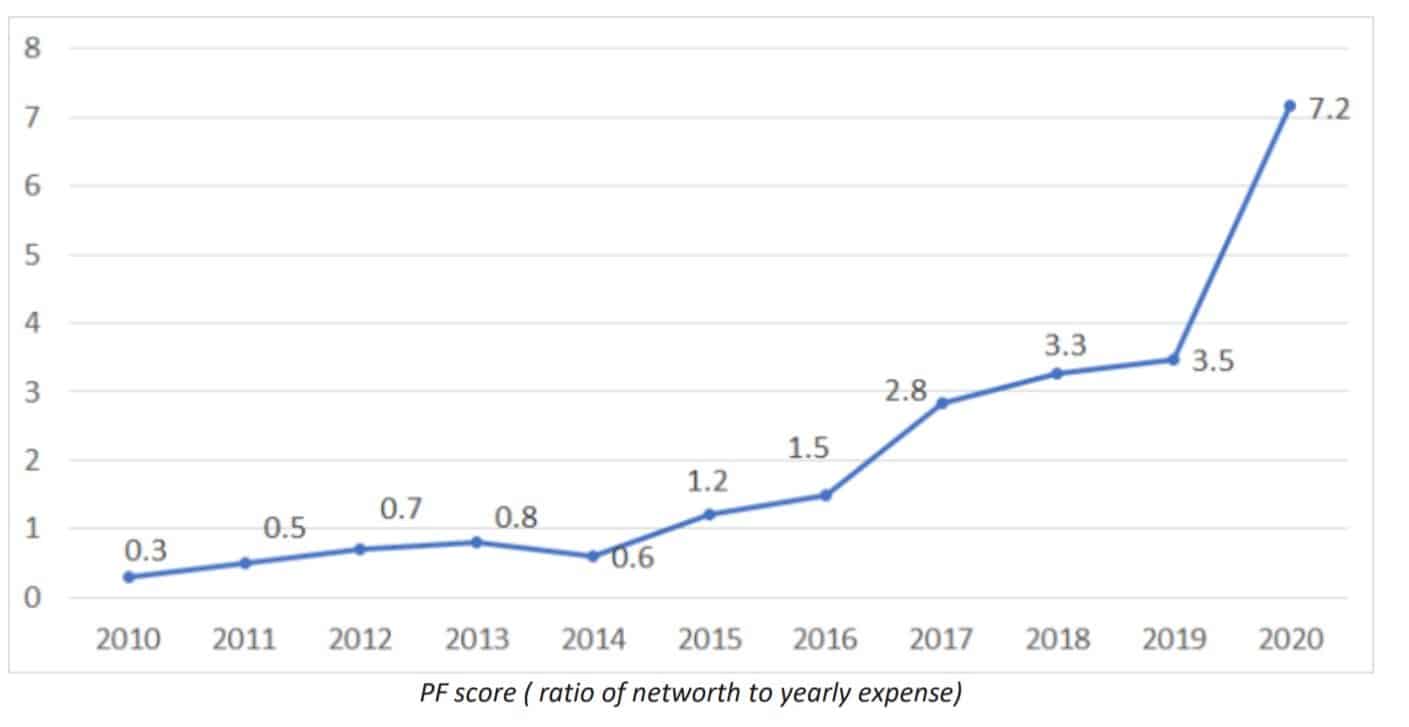
And finally, the most important metric. My PF (Personal Finance) score, which is my networth divided by yearly expense. What a jump from 3.5 to 7.2 in one year. And this year’s expense includes a significant one-time expense of house maintenance. If I exclude that and count only my regular expenses, then my
PF score is close to 10. But over the years, I have found that these “one-time” expenses keep coming so regularly that it’s best to always consider the full expense to calculate PF score.
Portfolio Breakup
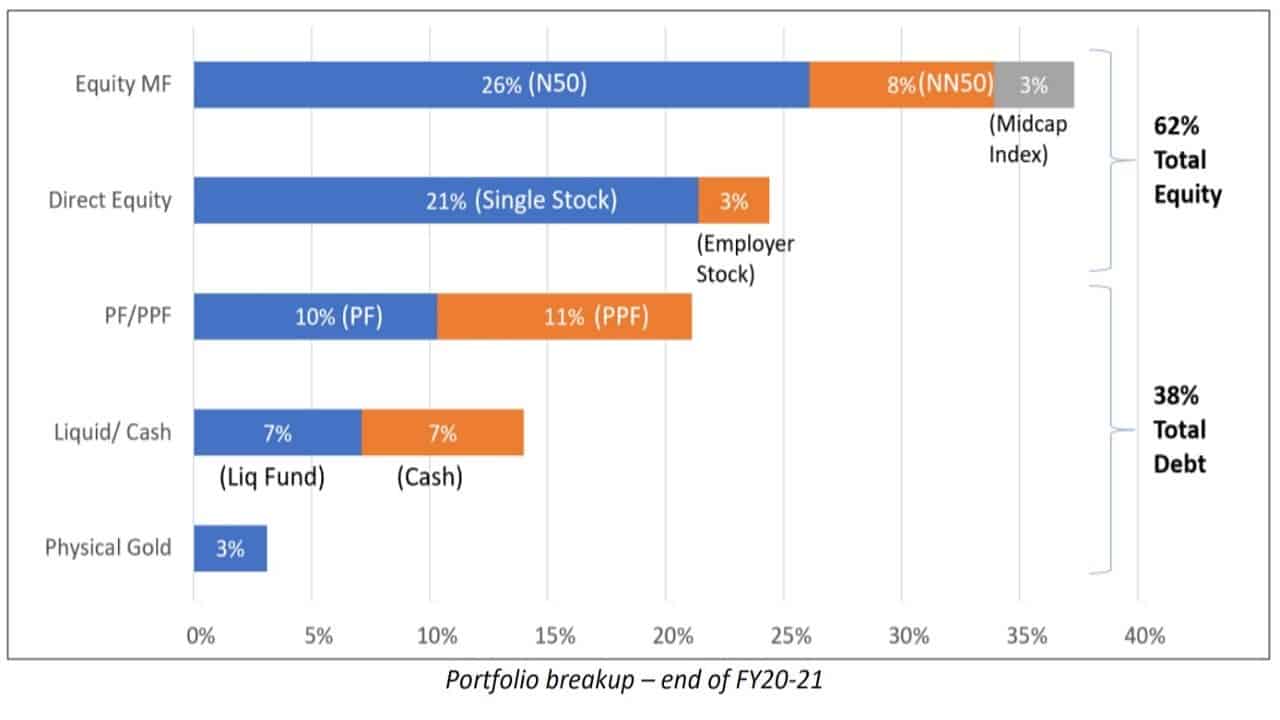
So good to see a neat portfolio breakup. The market crash and recovery allowed me fully clean up my portfolio with the below actions.
- In Feb 2020, I liquidated all my debt MFs.
- From Mar 2020 onwards, I started aggressively investing in the N50 fund to take advantage of the crash. By Sep, I hit my target equity allocation of 60%
- In Jan 2021, I realized I could rebalance my portfolio, simultaneously getting rid of my active mid cap fund, as well as bring down equity closer to 60% (which had reached 65% due to upward market movement).
- In addition, I invested a small amount in the MidCap Index, which set my allocation within the MFs as per my target of 70:20:10 for N50:NN50:MidCap.
On the debt side, this year, I started significantly increasing PF by setting high contribution in salary. PF comes to around 40% of my target savings. Hence remaining all 60% of savings can go to equity. In case I am able to save more or I have rebalanced out of equity, then I plan to invest in PPF. Thankfully in the near future, I do not see a need to look at any debt funds, which I find very challenging to invest. PF and PPF should take care of my debt side.
Liquid Fund / Cash is a very high percentage of total net worth right now. That is because a lot of “one-time” expenses are lined up in FY21-22 (CRATON corpus required at the time of need). See, as I said, these one time expenses keep coming regularly!! But once those expenses are done with, this category will only be my emergency fund.
Comparing portfolio breakup with the previous year gives an interesting insight on how my investment journey progressed in the year (Though the graph is in %, we can also easily discern the absolute gain since we can consider the FY21 portfolio double the size of FY20. For example, though %wsie my PF has remained same, in value terms it has doubled)
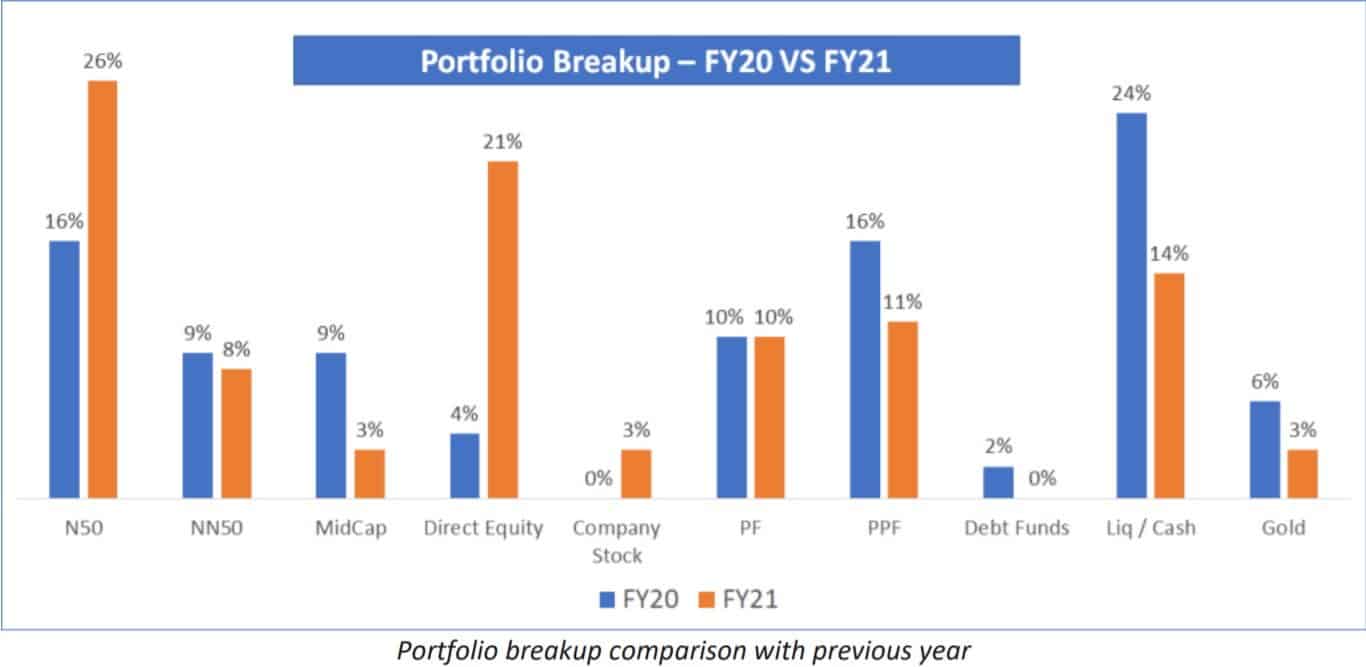
The standout gain in the graph is one direct equity stock that I hold. Almost half of the gains in FY20-21 came from this stock alone. It shot up from 4% of the portfolio to 21%, without making any additional investment to it. It was a small speculative investment I had made many years ago. It was languishing at a 40% loss and suddenly jumped up in the last couple of years. Investing in this stock made me realize direct equity is not for me. When the stock was languishing at a 40% loss, I did not have the courage to invest more, nor I am having the courage now to make an additional investment as I feel the stock may be overvalued, but at the same time, I do not want to sell any shares, due to greed that it might jump up again in few years.
In contrast, I am comfortable in index investing. Based on asset allocation, I can keep investing whether markets crash or jump up. However, I have given myself leeway to invest max 2 to 3% of my networth in any speculative investment which I find interesting.
Where do I stand in my Personal Finance Journey?
I had made a financial plan for my whole life back in 2010. How am I faring as compared to the targets I set for myself each year in the financial plan?
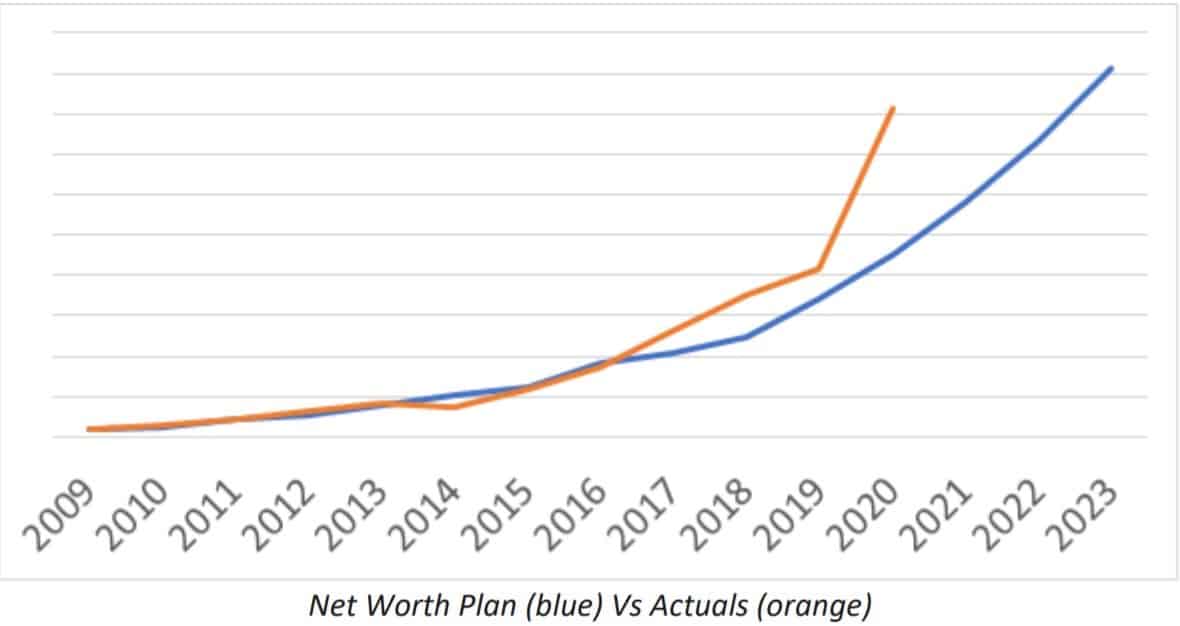
Unbelievably I am well ahead. Back in 2010, seeing the ridiculous numbers 10 years ahead, I never thought I would be comfortably beating them. If there is no major crash in markets and things go as planned, I would be able to keep pace with my planned networth for another 5 years.
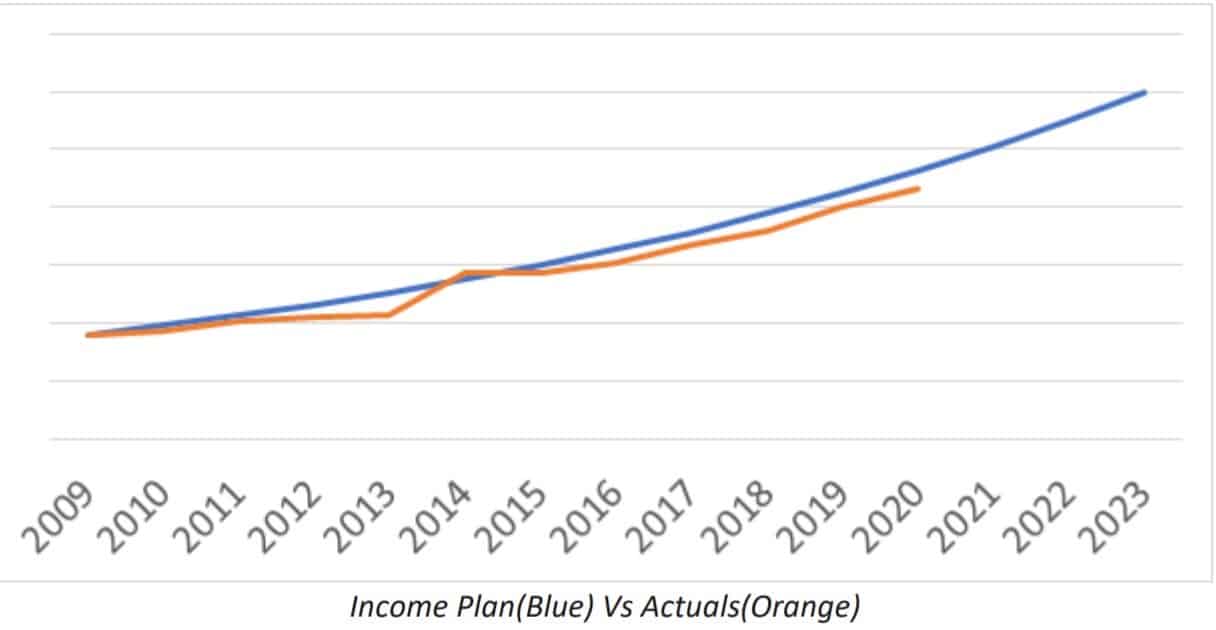
I had planned for a 9% increase in income. Not able to maintain that, and falling behind. I need a big jump in salary soon to catch up again.
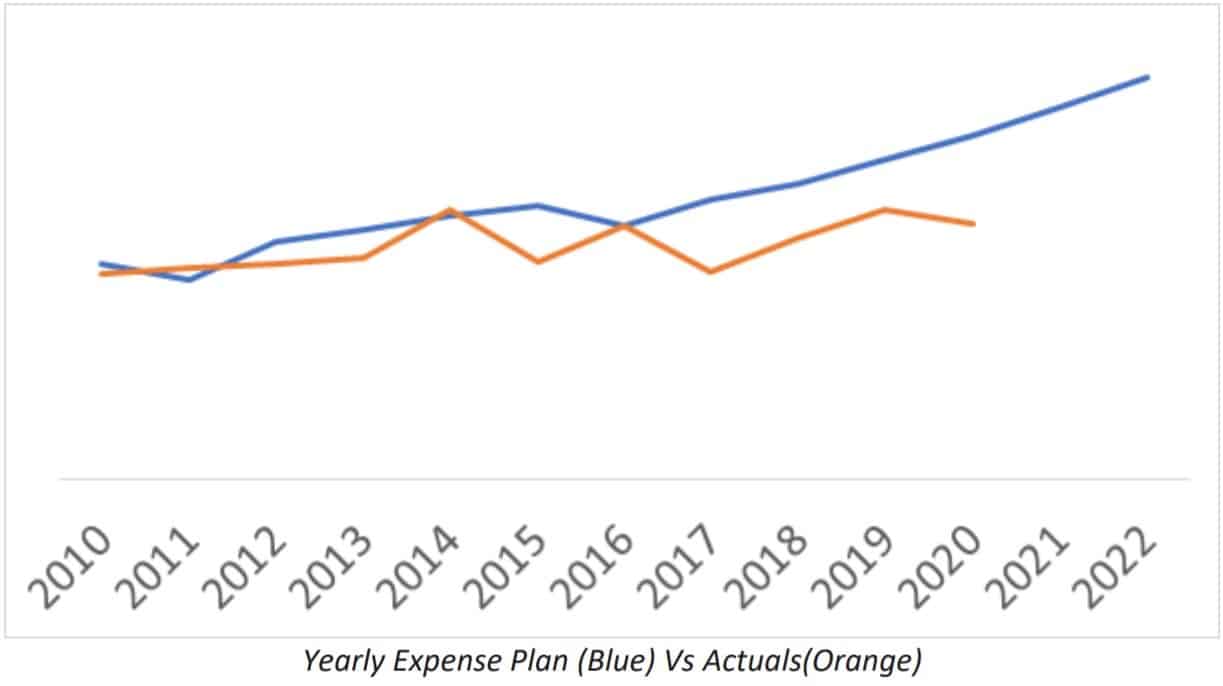
My expense graph is almost horizontal for a decade now. Systematically controlling my expenses has been the main pillar of building my net worth. To be fair, till 2014, expenses include my EMI loan payments as well. If I consider only my true expenses without EMIs, then expenses have gone up by 3X in the last decade. Still, to my credit, I have kept my lifestyle expense in check, as my expenses have remained range-bound since 2015. If I am able to keep my expenses in check for another 5 years, it would be great.
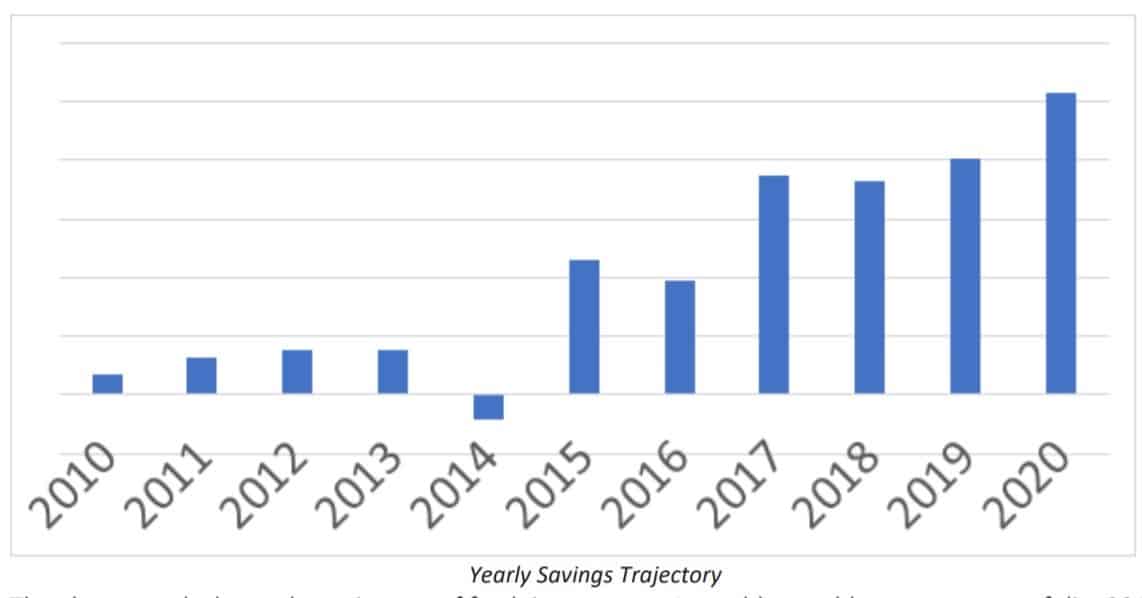
The above graph shows the trajectory of fresh investments I am able to add to grow my portfolio. 2014 is negative since I took out a small portion of my investments to clear all my loans. Once I cleared my debt, my savings jumped up. Then in 2017, I shifted my focus from tracking expenses to having a monthly investment target, as I mentioned earlier. I saw another step-change in my savings due to this new strategy. Hoping to keep on increasing my savings every year as much as possible.
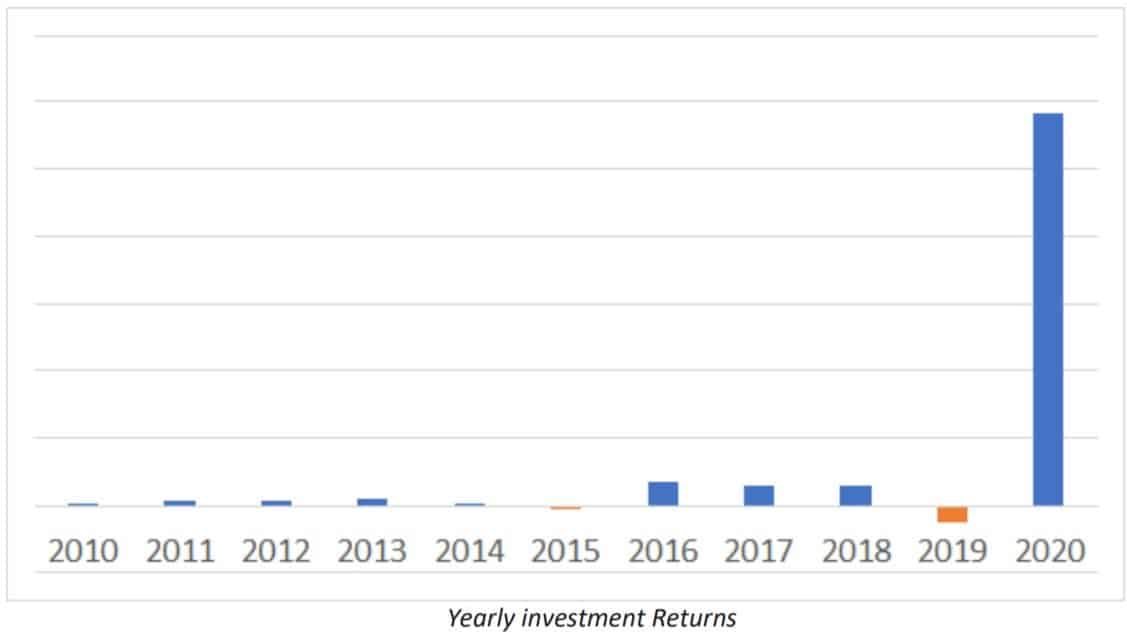
And finally, let me end by sharing this amazing graph. Though I knew the numbers, I myself was shocked to see the scale of returns this single year 2020-21 generated. The learnings and patience developed with a decade of equity investing finally have paid off. It also shows the lumpiness of returns that comes with equity investing. I must keep reminding myself that this lumpiness can come in a negative direction as well.
Hence, I am trying to keep asset allocation as a basis for investing. It has helped me to invest mechanically during Mar-Apr 2020 crash. Now I don’t track returns of my equity MF investments; I just go by asset allocation. I have developed a system to track my networth in real-time by punching few numbers in excel. If the calculation says my equity allocation is below 60% at the end of the month, I will invest in index MFs. Otherwise, it will go into debt. In FY20-21, I simplified my investment strategy and have put it on autopilot. Focus now is to grow my earnings.

Join 32,000+ readers and get free money management solutions delivered to your inbox! Subscribe to get posts via email! (Link takes you to our email sign-up form)
🔥You can also avail massive discounts on our courses and the freefincal investor circle! 🔥& join our community of 8000+ users!
Track your mutual funds and stock investments with this Google Sheet!
We also publish monthly equity mutual funds, debt and hybrid mutual funds, index funds, and ETF screeners, as well as momentum and low-volatility stock screeners.
You can follow our articles on Google News

We have over 1,000 videos on YouTube!

Join our WhatsApp Channel


- Do you have a comment about the above article? Reach out to us on Twitter: @freefincal or @pattufreefincal
- Have a question? Subscribe to our newsletter using the form below.
- Hit 'reply' to any email from us! We do not offer personalised investment advice. We can write a detailed article without mentioning your name if you have a generic question.
Join 32,000+ readers and get free money management solutions delivered to your inbox! Subscribe to get posts via email! (Link takes you to our email sign-up form)
About The Author
Dr M. Pattabiraman (PhD) is the founder, managing editor and primary author of freefincal. He is an associate professor at the Indian Institute of Technology, Madras. He has over 14 years of experience publishing news analysis, research and financial product development. Connect with him via Twitter(X), LinkedIn, or YouTube. Pattabiraman has co-authored three print books: (1) You can be rich too with goal-based investing (CNBC TV18) for DIY investors. (2) Gamechanger for young earners. (3) Chinchu Gets a Superpower! for kids. He has also written seven other free e-books on various money management topics. He is a patron and co-founder of “Fee-only India,” an organisation promoting unbiased, commission-free, AUM-independent investment advice.
Our flagship course! Learn to manage your portfolio like a pro to achieve your goals regardless of market conditions! ⇐ More than 3,500 investors and advisors are part of our exclusive community! Get clarity on how to plan for your goals and achieve the necessary corpus no matter the market condition!! Watch the first lecture for free! One-time payment! No recurring fees! Life-long access to videos! Reduce fear, uncertainty and doubt while investing! Learn how to plan for your goals before and after retirement with confidence.
Increase your income by getting people to pay for your skills! ⇐ More than 800 salaried employees, entrepreneurs and financial advisors are part of our exclusive community! Learn how to get people to pay for your skills! Whether you are a professional or small business owner seeking more clients through online visibility, or a salaried individual looking for a side income or passive income, we will show you how to achieve this by showcasing your skills and building a community that trusts and pays you. (watch 1st lecture for free). One-time payment! No recurring fees! Life-long access to videos!
Our book for kids: “Chinchu Gets a Superpower!” is now available!


Must-read book even for adults! This is something that every parent should teach their kids right from their young age. The importance of money management and decision making based on their wants and needs. Very nicely written in simple terms. - Arun.Buy the book: Chinchu gets a superpower for your child!
How to profit from content writing: Our new ebook is for those interested in getting a side income via content writing. It is available at a 50% discount for Rs. 500 only!
Do you want to check if the market is overvalued or undervalued? Use our market valuation tool (it will work with any index!), or get the Tactical Buy/Sell timing tool!
We publish monthly mutual fund screeners and momentum, low-volatility stock screeners.
About freefincal & its content policy. Freefincal is a News Media organisation dedicated to providing original analysis, reports, reviews and insights on mutual funds, stocks, investing, retirement and personal finance developments. We do so without conflict of interest and bias. Follow us on Google News. Freefincal serves more than three million readers a year (5 million page views) with articles based only on factual information and detailed analysis by its authors. All statements made will be verified with credible and knowledgeable sources before publication. Freefincal does not publish paid articles, promotions, PR, satire or opinions without data. All opinions will be inferences backed by verifiable, reproducible evidence/data. Contact Information: To get in touch, please use our contact form. (Sponsored posts or paid collaborations will not be entertained.)
Connect with us on social media
- Twitter @freefincal
- Subscribe to our YouTube Videos
- Posts feed via Feedburner.
Our publications
You Can Be Rich Too with Goal-Based Investing
 Published by CNBC TV18, this book is designed to help you ask the right questions and find the correct answers. Additionally, it comes with nine online calculators, allowing you to create custom solutions tailored to your lifestyle. Get it now.
Gamechanger: Forget Startups, Join Corporate & Still Live the Rich Life You Want
 This book is designed for young earners to get their basics right from the start! It will also help you travel to exotic places at a low cost! Get it or gift it to a young earner.
Your Ultimate Guide to Travel
 This is an in-depth exploration of vacation planning, including finding affordable flights, budget accommodations, and practical travel tips. It also examines the benefits of travelling slowly, both financially and psychologically, with links to relevant web pages and guidance at every step. Get the PDF for Rs 300 (instant download)