Last Updated on December 29, 2021 at 5:43 pm
Even an occasional market observer would know that the NASDAQ 100 index has zoomed past the S&P 500 after the March 2020 market crash. Has it begun to correct now? I received this question a couple of days ago. “I have been investing in Motilal Oswal NASDAQ 100 Fund of Fund via SIP since inception (against your advice!) and my SIP returns (XIRR) is about 45%. I am now scared that the NASDAQ 100 has moved up too much and will fall soon. Is it time for me to book some profits?”
The NASDAQ is significantly less diversified than the S &P 500 and therefore significantly more volatile. The big five stocks Facebook, Amazon, Apple, Microsoft, and Google (Alphabet) make up about 40% of the NASDAQ 100 and only 21% of the S & P 500. Data from slickcharts.
Risk-averse investors are better off with the S& P 500 for their “international diversification” needs than the NASDAQ 100. Risk aversion includes both huge upside and huge downside. Cannot have one without the other.
🔥Secure your future with our Robo-advisory tool trusted by over 3,500 investors and advisors. From effortless retirement planning to funding your children’s biggest dreams, turn your financial goals into reality. 🔥
Subscribe for money management solutions via email! (Link takes you to our email sign-up form) Join 32,000+ readers in our community.
👉 New Tool Alert! NaviPlan: A Privacy-Focused Multi-asset Tracker and Goal Planner 👈
Most Indian investors who wanted to “diversify their portfolio with US stocks” (read saw huge returns and then jumped in) would only have 5% to 20% exposure to the NASDAQ 100 (whether they bothered to invest with a set allocation or not).
Therefore it would be best if they made investment decisions based on deviation from an intended allocation. For example, say if your preferred N100 allocation is say, 15% (of your entire portfolio). If you started investing in the Motilal Oswal NASDAQ 100 Fund of Fund from Dec 2018 and your current N100 weighty is 20% or more (that is 5% or higher than intended) then I would recommend that you rebalance the portfolio.
Not “book profits” (that is not possible as you cannot separate gain from the investment when you redeem), but “rebalance”. Sell 5% of your N100 FOF value and shift it to fixed income. Suppose you only started investing just a few months ago, the gain is not substantial and the weight has not increased by 5%, then do nothing. This simple weight-based “strategy” will reduce confusion and systematically reduces portfolio risk.
NASDAQ 100 Valuation
Considering its huge up/downswings in the past, N100 valuation can be tricky. For what it is worth, let us consider where the index is at presently. According to Bloomberg, the current P/E ratio of 36 is well above the 10-year average of 22. See a chart up to Jun 2017 for reference. That hardly means a fall is imminent for this index.
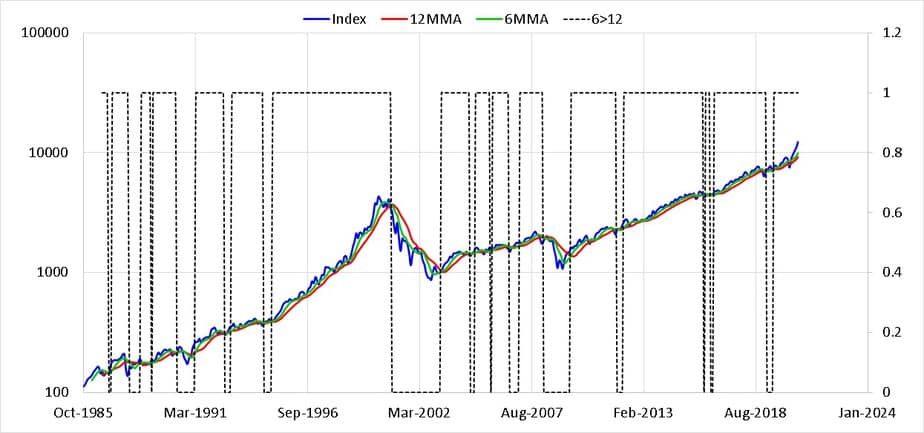
Using the tactical buy/sell tool, this is a plot of NASDAQ 100 Price in USD (dividends not included) and its six and twelve-month moving averages. The dotted line has a value of one when the six-month average is greater than the twelve-month average. These are monthly price charts
You can refer to more details and backtests using this idea here: (1) Is this a good time to buy gold? A tactical buying strategy for gold (2) This “buy high, sell low” market timing strategy surprisingly works! (3) Do not use SIPs for Small Cap Mutual Funds: Try this instead! (4) Can we get better returns by timing entry & exit from gilt mutual funds?
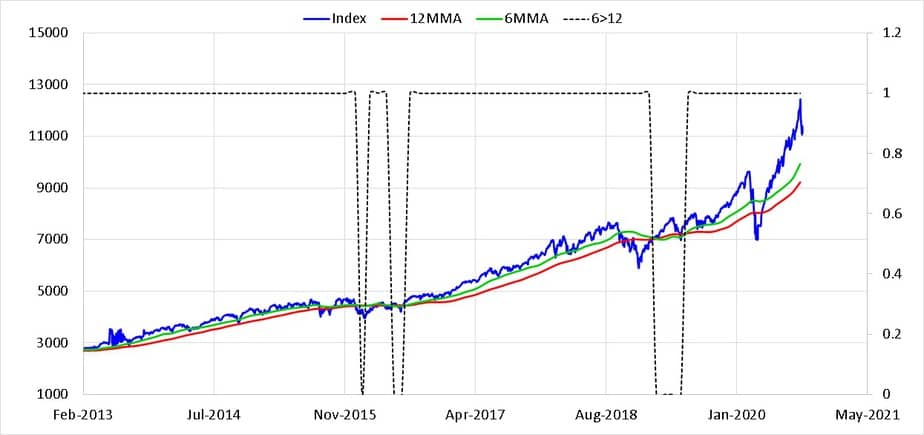
This is a close-up of the same graph on a normal scale with daily data (the above is monthly data). Notice how much the price has pulled away from the averages. It is still high in spite of the recent “reversal”. If we are to only follow the rules mentioned in the above references then it is not yet time to “sell” for those interested in tactical play. The simple asset allocation idea mentioned above is more than good enough for most investors.
The significance of how much the N100 has moved up can be seen from the percentage deviation of Nasdaq 100 USD price from six-month moving average with Nasdaq 100 USD price (right axis).
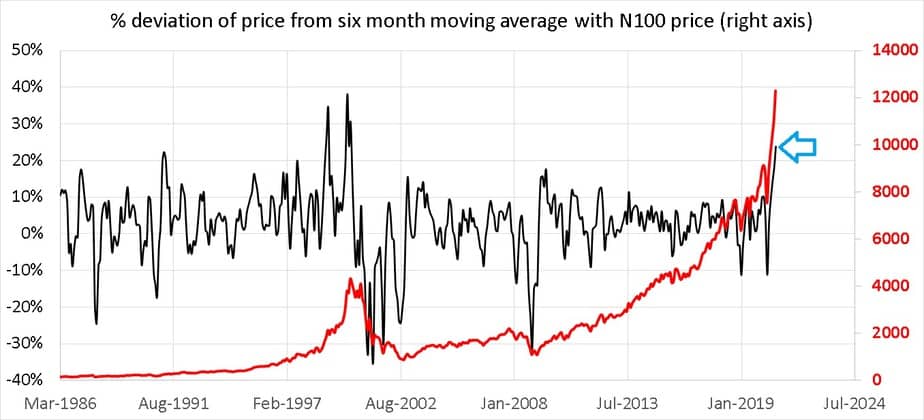
The deviation was the highest since the dot-com bubble and has since sharply corrected.
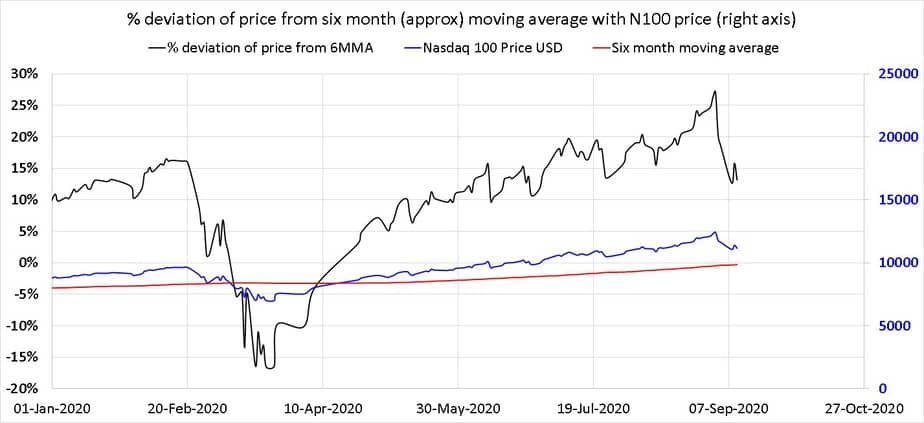
As the world is emerging from the lockdown and life gets back to normal, it would be best if investors tone down their expectations from US equity (both indices). Of course, the index could defy all logic and keep moving up or correct. No one can tell. This is why a focus on asset allocation with periodic rebalancing gets the job done.
Sign up for a new course on How to get people to pay for your skills! This discusses a simple framework for consistently growing your business with online visibility! Suitable for passive income seekers, small business owners and bloggers. Use this form to sign up for 60% early bird discount! You will be intimated upon launch.