Last Updated on February 9, 2024 at 9:14 pm
Use this Excel sheet to track and compare the annualized return (XIRR) of your mutual fund investments with that of a benchmark. This is the updated version of the Mutual Fund SIP XIRR Tracker thanks to Krishna Chaitanya who pointed out an error in the sheet. The Nifty strategic indices have also be updated up to April 10th 2017.
The sheet includes a ‘cumulative outperformance’ feature. This gives you the no of times the fund has out-performed its index on a month by month basis. This is a key indicator of a drop in performance. Read more: Should I continue my SIP in HDFC Top 200 Fund?
What is XIRR? When you invest a lump sum in a volatile instrument (equity, debt fund, gold fund etc.), the average rate at which the investment has compounded is given by the CAGR
When you invest periodically in the same instrument, instead of CAGR, a quantity called the XIRR, is calculated. This can be interpreted as the average CAGR of all the instalments.
🔥Secure your future with our Robo-advisory tool trusted by over 3,500 investors and advisors. From effortless retirement planning to funding your children’s biggest dreams, turn your financial goals into reality. 🔥
Subscribe for money management solutions via email! (Link takes you to our email sign-up form) Join 32,000+ readers in our community.
👉 New Tool Alert! NaviPlan: A Privacy-Focused Multi-asset Tracker and Goal Planner 👈
Read more:
Understanding Annualized Return: CAGR and XIRR
If you track this XIRR month after month for a SIP instrument and compare it with corresponding number for a benchmark, it gives you a idea of how consistently the fund has beat the benchmark.
To measure consistency, rolling returns calculation is performed. An automated calculator for this can be found here
A rolling SIP return calculation is hard to compute. Monthly XIRR tracking can be considered as an alternative.
Indices available:
As seen in a recent series of posts, Nifty strategic indices are tougher benchmarks for mutual funds to beat. Therefore, using these benchmarks would be a better way to separate the wheat from the chaff. A couple of these indices were also studied in detail:
- Nifty50 Value 20 Index (NV20) as a mutual fund benchmark
- Nifty Low Volatility 50: A Benchmark Index to watch out for
A total of 51 benchmarks are now available for comparison.These include Nifty TRI, Sensex TRI, BSE 200 TRI, BSE 500 TRI,Nifty, CNX 100, CNX Mid Cap, CNX 500, Sensex, BSE 100 ,200, 50 etc.
TRI refers to total returns index. That is the index has been calculated with dividends reinvested.
The user needs to obtain them manually from the S&P website (updated up to 4th April 2016). Links for updating each index is provided in the sheet.
The TRI indices are stored in the sheet while other indices are downloaded from Moneycontrol.
The six strategic indices are:
- NV20 – 20 value stock from within Nifty.
- NQ30 – 30 quality stocks from NSE listing.
- Alpha50 – 50 alpha generators from top 300 NSE stocks (market cap)
- NDivOpp – Top 50 dividend yield stocks from top 300 NSE stocks (market cap)
- NLV50 – 50 least volatile stocks from top 300 NSE stocks (market cap)
- NGS15 – Top 15 growth stocks from top 50% market cap of all sectors with PB and PE greater than the Nifty.
The strategy indices also need to updated from the NSE site (updated currently up to June 30th 2016).
Here are some sample results.
XIRR is calculated only after 1Y from start of the SIP.
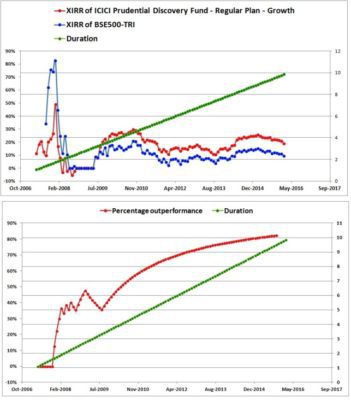
On the left, you have the XIRR data for the fund and benchmark, along with the green line which represents the duration of the SIP in years (in both plots). Please note the return is calculated after each instalment. So it is cumulative and not monthly performance.
On the right the cumulative percentage outperformance is tracked. Had the funds return dipped below its benchmark then the outperformance graph would have dipped.
These are some previously published results.
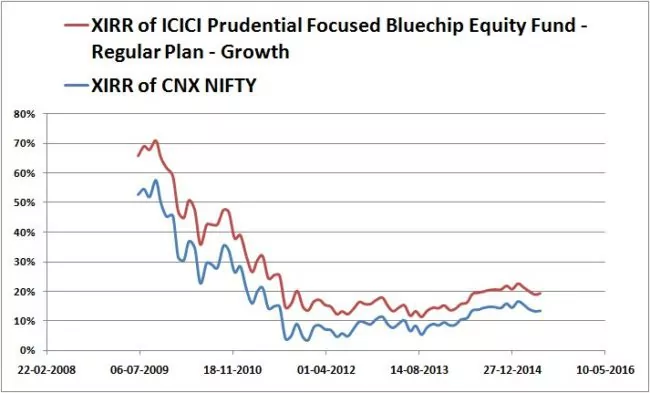
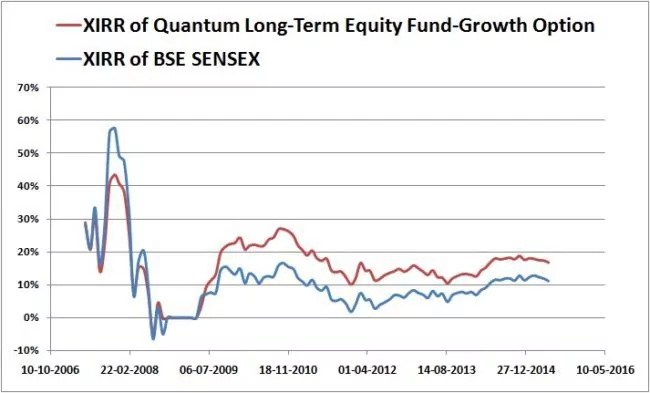
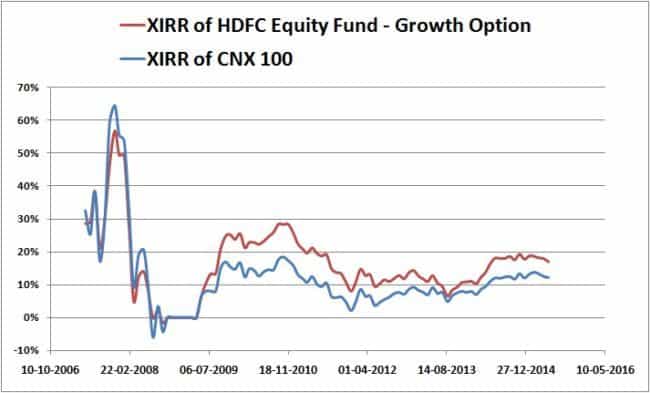
Note: XIRR becomes more reliable as the SIP gets older. So ignore the large swings that occur at the start.
All the funds have done pretty well. In terms of consistency, ICICI Blue Chip > QLTE > HDFC Equity.
Try this out for your own holdings and let me know how the tool can be improved.
This tool is now part of the freefincal investor circle.