Last Updated on December 29, 2021 at 4:49 pm
Momentum investing is such a simple strategy that it could even invite ridiculing laughter. Yet, it works: Momentum Stock Investing in India: Does it work? Yesterday the Momentum, Low Volatility Stock Screener June 2019 was released. This allows you to screen for momentum stocks with low volatility (quality momentum) among the Nifty 100 stocks. In this post, we ask what if we used a Nifty Momentum model to time the market.
Before we begin, if you forgot to check out the latest videos, here they are (watch them after you read this post!) [1] Do not make these 15 investing mistakes!! [2] Personal Finance: Know Where You Stand Checklist (free download!) [3] How to generate tax-free income from mutual funds
What is momentum investing? It quite simply means, look at the past 6-12 months returns of a security and if it is moving up, buy it or buy more of it. Once it stops moving up (or moving up less) dump it and buy another with higher momentum. There some nuances like looking for momentum quality. That is upward movement with less volatility and also relative momentum we two asset classes or even securities are compared.
Important: The results you see below have nothing to do with momentum stock investing. The pros and cons of momentum stock investing are quite different where one will have to consider a higher rate of churn, especially in the mid and small cap space. This is the reason why I have restricted myself to the Nifty 100 space.
🔥Secure your future with our Robo-advisory tool trusted by over 3,500 investors and advisors. From effortless retirement planning to funding your children’s biggest dreams, turn your financial goals into reality. 🔥
Subscribe for money management solutions via email! (Link takes you to our email sign-up form) Join 32,000+ readers in our community.
👉 New Tool Alert! NaviPlan: A Privacy-Focused Multi-asset Tracker and Goal Planner 👈

Warning and Disclaimer
The following is to be treated as investment research based on past data unrepresentative of practical implementation and is not investment advice. They do not factor in behavioral/emotional aspects associated with investing. If you do not know how to understand a backtest result, evaluate its disadvantages, then please, please DO NOT play with your money using market timing. Please watch this video before proceeding further.
What is meant by tactical asset allocation (TAA)?
Asset allocation is the ratio of much equity, fixed income, gold, cash etc. is present in a portfolio. We will only consider equity and fixed income in this study. Tactical asset allocation (TAA) refers to changing these allocations based on certain factors or indicators.
What is market timing?
It is a technique to reduce portfolio risk and/or enhance portfolio returns by changing asset allocation based on our reading of where the market will head in the near future. This can be the stock market, bond market, gold market etc.
Is tactical asset allocation necessary?
Yes, as the risk associated with a portfolio must be systematically reduced or contained to ensure we have enough money for our future needs.
Is market timing necessary?
No. Tactical asset allocation is necessary and one need not resort to market timing to do this. TAA is possible based on a target corpus associated with a financial goal. See:
Part 1 How to reduce risk in an investment portfolio
Part 2 Do we need to time the market?
Part 3 Why we need to gradually pull out of equity investments well before we need the money!
Can we time the market?
Yes. However, realistic and reproducible market timing methods have often primarily reduced risk with or without return enhancement. See results here: Want to time the market with Nifty PE? Learn from Franklin Dynamic PE Fund and here: Is it possible to time the market?
Previous parts on the tactical asset allocation series1:
1: Do we need to time the market?
2: Market Timing with Index PE Ratio: Tactical Asset Allocation Backtest Part 1
3: Market Timing With Ten Month Moving Average: Tactical Asset Allocation Backtest Part 2
4: Tactical Asset Allocation Backtest Part 3: Short-Term Vs Long-Term
What is the Nifty Momentum Timing model?
I have considered two different types of datasets for backtesting. We use Franklin India Blue Chip Fund for the Equity component and
We consider the past six-month returns of both equity and debt. If the equity return is higher than debt, then invest in equity and sell off all existing debt and invest in equity. If the debt return is greater than equity, then invest in debt, sell off equity and invest everything in debt. This might sound drastic, but let us quantify it.
Systematic investing A total amount of Rs. 1000 will be invested into the portfolio in specified asset allocation (50:50). The systematic portfolio will be rebalanced once a year. To account for exit loads and tax associated with this, the final portfolio amount will be reduced by 4%.
Tactical investing with the rules detailed above. The final tactical portfolio is reduced by 20% (this is 5 times the amount assumed for the systematic portfolio as the average no of trades in 10Y is about 5). This 20% accounts for exit loads of equity and fixed income and tax associated with equity.
Fifteen years, 60:40 asset allocation
First, we shall consider all possible 15 year periods and the systematic investment will have 60% equity and 40% debt asset allocation with annual rebalancing. The tactical asset allocation will swing from 100% equity (if last 6 months equity returns > last 6 months debt returns) to 0% (for opposite scenario).
Astoundingly the avg number of equity sell-offs is only 12-13 . This means, although we are looking at the last 6 month returns each month, the equity holding has been sold less than a year on average for 15-year intervals. Why is this astounding because in the systematic portfolio, for 15Y, there will be 15 rebalancing events!
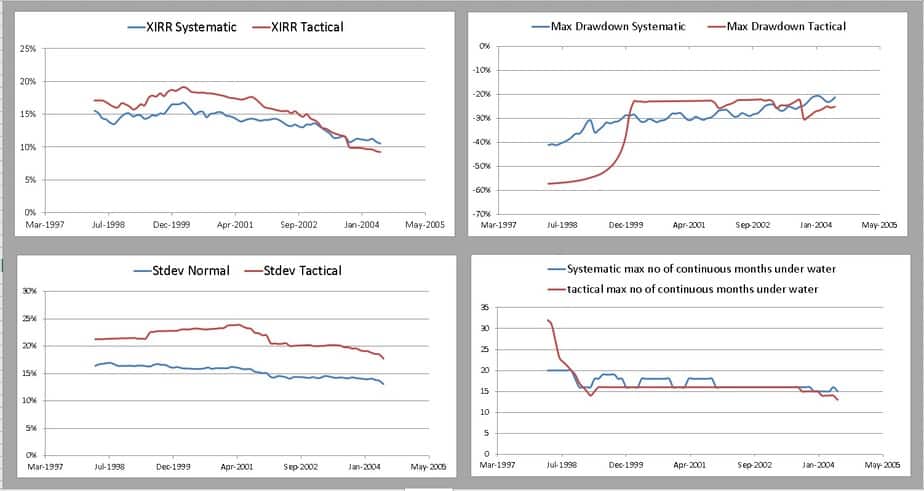
Top Right: The maximum fall of the portfolio from a peak is compared. The vertical axis is negative. So lower the value, the more the fall, the more the risk.
Bottom left: Standard deviation or how much the monthly returns fluctuate is compared. Higher the value, the higher the fluctuation, the higher the risk.
Bottom right: The no of months, the portfolio was continuously lower than a previous peak (underwater) is compared. Higher the no of months, higher the risk.
The Nifty momentum timing strategy is clearly a higher risk, potentially higher strategy and seems to have worked reasonably well in the past in term of return. However, a higher risk is a guarantee and that is a problem. The drawdown (fall from peak) is higher but the no of months the portfolio is continuously underwater is not much different.
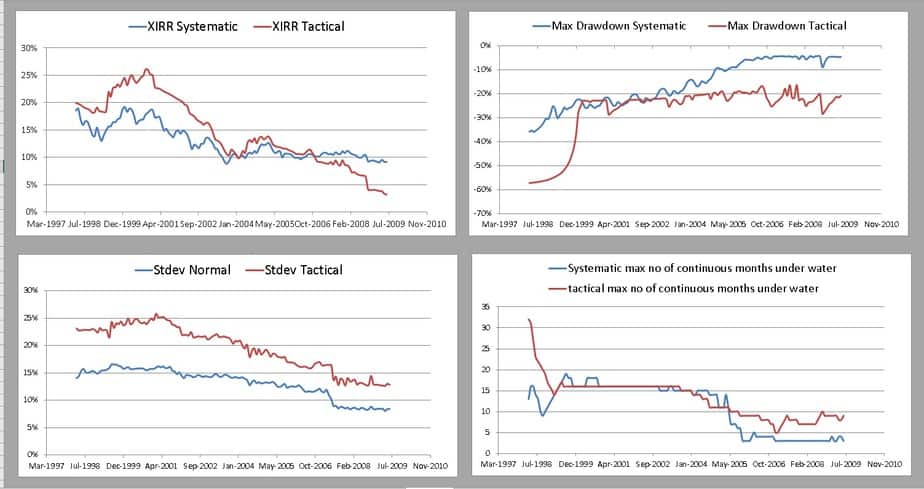
Ten years, 50:50 asset allocation
Here we consider a 5-:50 allocation for the systematic investment with annual rebalancing. The no of equity sell-offs over a10 year period was only 8 on average.
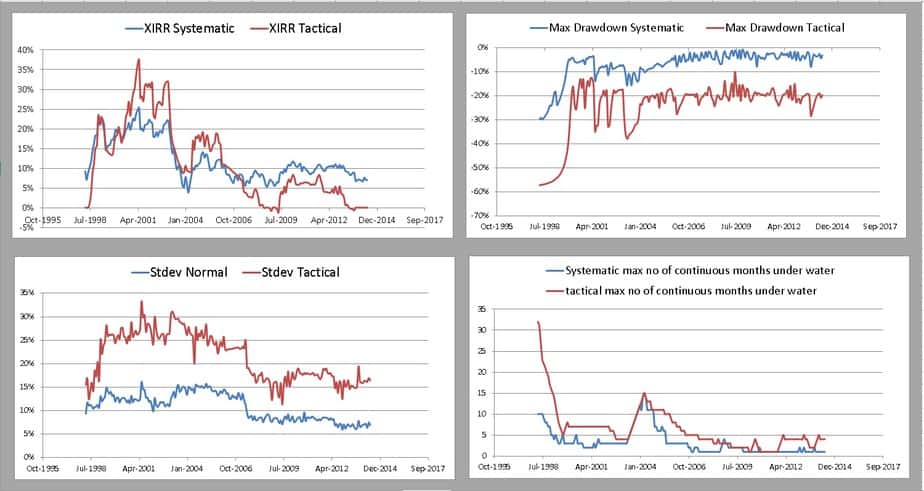
Five years, 40:60 asset allocation
Finally a 5-year duration (risky, and not advisable, but still for the sake of backtesting). Here the higher return practically becomes a coin toss.
Summary
The Nifty momentum timing model is more riskier than a systematic approach with annual rebalancing. For this extra risk, sometimes the reward is higher and sometimes not. However, surprising the portfolio churn is quite acceptable and actually lower than the systematic portfolio!!
Some improvements to the timing model studied are possible: Including volatility of monthly returns during the six month period and varying the six-month duration. I will take that up if there is interest.
Check out the Momentum, Low Volatility Stock Screener June 2019