Last Updated on October 8, 2023 at 1:36 pm
In a two-part post, I discuss the nature of stocks market returns, first by pointing out the influence of extreme market events and then by considering their fractal or self-similar nature. Readers may recall that last week, we considered self-similarity in wealth distribution where I had mentioned their universal nature.
Both posts in this series shall deal with the same data set: daily, weekly and monthly returns of the S&P 500 from Jan 3rd, 1950 to Jan 21st, 2017 obtained from Yahoo Finance.
Before we begin a quick announcement: I have added SEBI registered fee-only planner Piyush Khatri to my List of Fee-only Financial Planners in India. Piyush is based in Hyderabad but can travel to Bangalore if necessary.
101: The nature of stock market returns
The most common representation of stock market returns is the bell curve.
🔥Secure your future with our Robo-advisory tool trusted by over 3,500 investors and advisors. From effortless retirement planning to funding your children’s biggest dreams, turn your financial goals into reality. 🔥
Subscribe for money management solutions via email! (Link takes you to our email sign-up form) Join 32,000+ readers in our community.
👉 New Tool Alert! NaviPlan: A Privacy-Focused Multi-asset Tracker and Goal Planner 👈
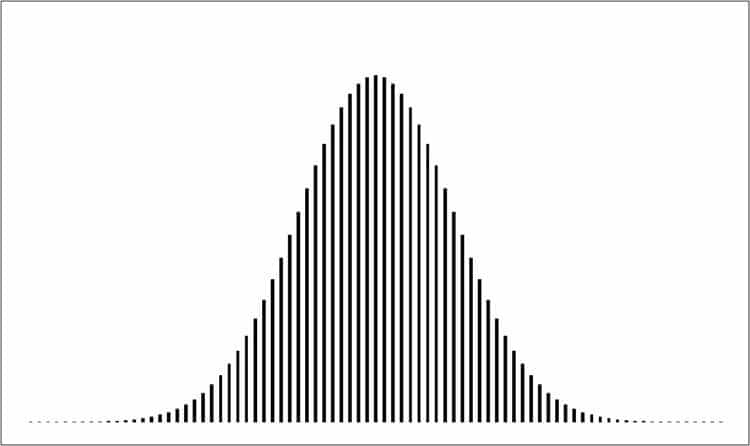
The horizontal axis is the returns (daily/weekly/monthly/yearly) and the vertical axis is how frequently a particular value of return was observed.
The most frequent return is in the centre – aka the average or the (arithmetic) mean.
The standard deviation or departure from the mean (a measure of risk) is represented by the width of the curve.
One of the most important properties of this “distribution” is how rapidly the frequency (or probability) of observing returns well above or well below the average decreases.
For example, if the average return is +10%, the probability of observing a return of +100% or -100% is practically zero, as per this curve.
I had earlier written about this and how to understanding the idea of compounding here: Understanding the Nature of Stock Market Returns
However, extreme market events are rare, but not improbable. For example, the Sensex rose by an astounding +270% due to price fixing by Harshad Mehta. When the scam was exposed, the markets corrected (only!) by -40%.
These returns cannot be explained by the bell curve. The alternatives, however, are not easy to handle. Therefore to help us get an idea about how much returns can swing, I had ignored these extreme events and had used a modified bell curve to estimate: The Return I Expect From Equity Over the Long-term? (Part 2).
However, I believe it is our duty to understand what we are up against as completely as can and hence this series will be called The “true nature” of stock market returns.
In this post, I shall focus on the deviation from a bell curve. To understand this, let us look at an ideal bell curve with the vertical axis plotted in log scale. We will use this as a reference.
The Bell Curve In Log Scale
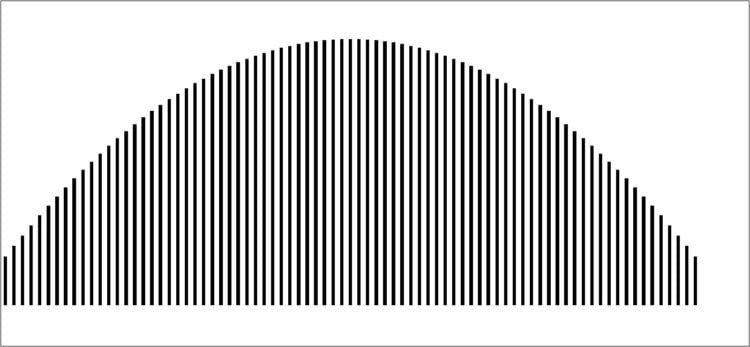
Two key features:
1: The slope off from the central peak is gentle.
2: The slope is smooth. The probability decreases constantly away from the centre.
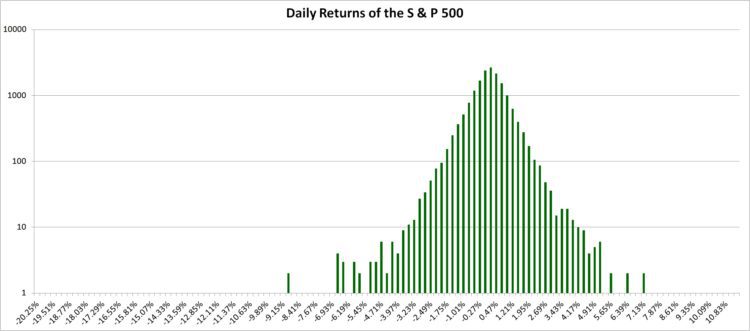
Both these features will be absent when we consider real data.
Daily Returns of the S & P 500 (log scale)
Weekly Returns of the S & P 500 (log scale)

Monthly Returns of the S & P 500 (log scale)
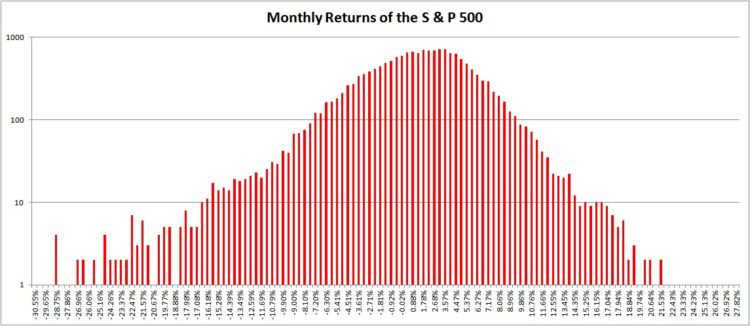
The fat tails are those spikes that stand out (or down) from the rest of the distribution. Many have written about this, the first being Benoit B Mandelbrot. What is often overlooked is the fact that real-life distributions are much thinner than a bell curve. The fall from the peak is rapid (this, of course, decreases as we go from daily to monthly returns).
Daily returns vs time for a bell curve (Ideal)
If the daily returns are plotted against date (time) then it should look like this: range bound and no abnormal spikes.
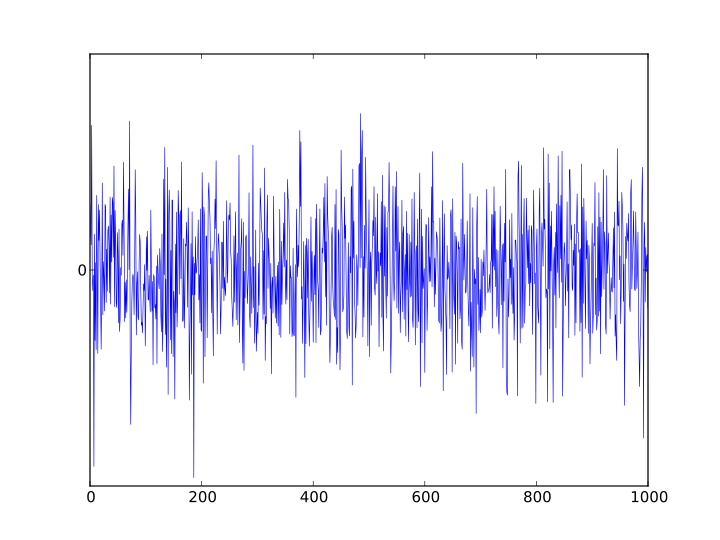
In other words, if stock returns followed a bell curve, the market would be a zero-sum game. It is not.
Daily Returns vs Time (Real data)
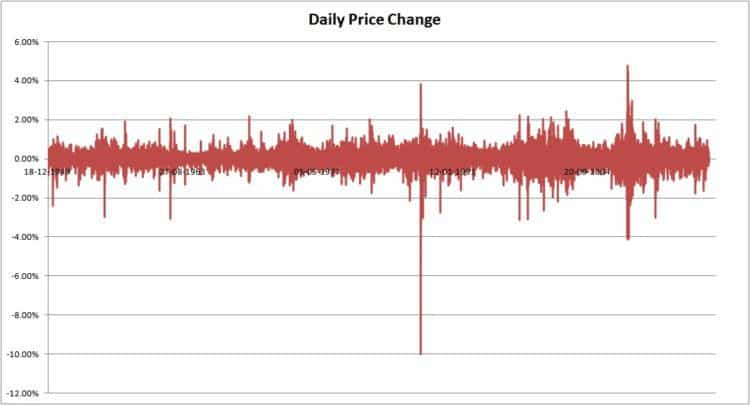
Notice that huge upward and downward spikes. Those are the fat tail or black swan events.
If we had a used a bell curve model (and most of us still do), those events would be more than impossible!! Yet those returns are quite possible and occur with reasonable regularity, but not frequently.
The danger with modelling risk based on a bell curve is that we overlook these wide swings. Doing so could change our life’s forever.
Handling fat tail events mathematically is not easy simply because of the number of parameters involved. So a bell curve approximation is a reasonable foothold, provided we understand the serious limitations.
Unfortunately, a model if used long enough appears like a law of nature and enough people do not “bother to look” (from “the Big Short”) deeper.
Take my own learning curve. Being a physicist, I saw the bell curve is a law of nature. However natural process follows a set of rules, written in stones. If those rules are disobeyed, there would no life on Earth.
So I made the mistake of assuming the same for the stock market. It is when I started learning about departures from the bell-curve, I moved away from the associated greek alphabets – alpha, beta, omega, the Sharpe, Sortino and Treynor ratios to just downside and upside capture ratios.
My goals for this year: develop tools for analysing fat tails and self-similarity (to be covered in part 2)
So, how do we account for extreme events? First, we understand their nature better. We shall do this in part 2.
References
The (Mis)Behaviour of Markets: A fractal view of risk, ruin and reward by Benoit B Mandelbrot (available at Amazon.in)
The variation of certain speculative prices, The Journal of Business, Vol. 36, No. 4 (Oct 1963), pp. 394-419, by Benoit B Mandelbrot. Available here
PUNE DIY Investor Meet Feb 26th 2017
The second Pune DIY meet will be held on 26th Fb 2017. You can register via this link
You Can Be Rich Too With Goal Based Investing
Your first investment should be buying this book
The calculators are really awesome and will give you all possible insights
Thank you, readers, for your generous support and patronage.

Amazon Hardcover Rs. 267. 33% OFF
Kindle at Amazon.in (Rs. 267)
Google Play Store (Rs. 244.30)
Now just Rs. 280 with additional 10% discount with code: Republic10 at Infibeam
If you use mobikwik wallet, and purchase via infibeam, you can get up to 100% cashback!!
- Ask the right questions about money
- get simple solutions
- Define your goals clearly with worksheets
- Calculate the correct asset allocation for each goal.
- Find out how much insurance cover you need, and how much you need to invest with nine online calculator modules
- Learn to choose mutual funds qualitatively and quantitatively.
More information is available here: A Beginner’s Guide To Make Your Money Dreams Come True!
What Readers Say


Also Available At
Bookadda Rs. 371. Flipkart Rs. 359
Amazon.com ($ 3.70 or Rs. 267)
Google Play Store (Rs. 244.30)