Last Updated on December 28, 2021 at 6:26 pm
How much return can I expect from the stock market? What is long-term in the stock market? What is the risk associated with the stock market? Regular readers may be aware that I have discussed these questions with returns and risk spreads from time to time. In my most comprehensive analysis, Sensex return charts for the last 35 years along with the return distributions are presented. These provide a visual representation of stock market risk.
Usually, the no of data points considered to plot the stock market risk-reward spectrum is only a handful. See this earlier study for example: What Return Can I Expect From Equity Over the Long term? Part 1
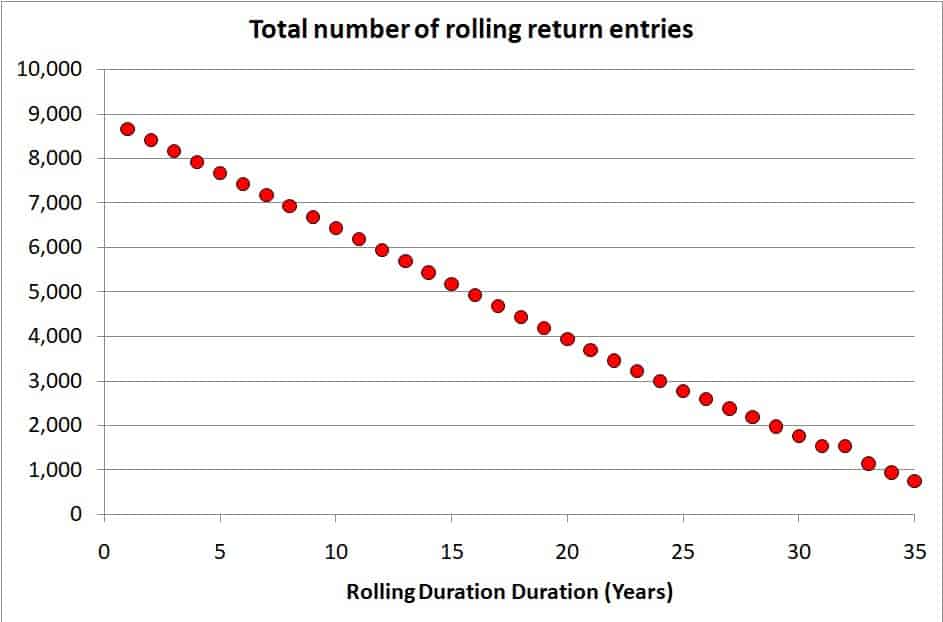
Using the rolling returns calculator, we can look at 1,2,3,4,.5, …. 30,31,32,33,34,35 year Sensex returns on rolling basis. From 8,649 one-year data points to 739 35-year data points. An overall total of 1.58 lakh data points.
Before we begin some important considerations
If you are a mutual fund sales guys do not waste your time reading this post. No one will buy equity mutual funds if you tell them about risks. The problem is that investors and many advisors simply assume “systematic” buying is all that is necessary to get “good returns”
Join 32,000+ readers and get free money management solutions delivered to your inbox! Subscribe to get posts via email! (Link takes you to our email sign-up form)

🔥Want to create a complete financial plan? Learn goal-based investing? Exclusive access to our DIY tools? Increase your income with your skills? Use this link to enjoy massive discounts on our robo-advisory tool & courses! 🔥
- Our markets are quite young and we were a developing country (less so now). This means that the long-term past performance will always be rosy. Please be cautious about extrapolating it into the future.
- Our long-term market returns are heavily influenced by the Harshad Mehta scam – a proper bubble, not just a bull run. You can the tool in this post to understand its impact: Understanding the Nature of Stock Market Returns.
- The returns before FII investing began are of a different nature. Today all economies are heavily inter-linked.
- Our fixed income in the past was truly fixed. Only recently it has become market linked. This will have an impact on equity too from now on. The penetration of corporate bonds was weak in the past.
- Over-confidence is a common investor trait. Expect no more than 10-12% returns from equity and that too over 10 years and that too with risk management.
- Do not believe what product sellers will tell you. A Mutual Fund SIP is Hope, Not a Strategy!
- Understand the difference between probability and possibility. You should be worried about the possibility of losing money and not the probability of losing money. You should be worried about the possibility of poor returns and not about the probability of poor returns whether it is long-term or short-term.
- Wait for the results for a well-developed country with a longer market history before assuming that “equity will work over the long-term” – will consider S &P 500 rolling returns next week. You can check out an earlier study here: Will long-term equity investing always be successful?
- Some people make a song and dance about Indian equity never giving -ve returns over 15 years. Well, when you collect 5171 15-year data points and notice that 250 of those are single-digit returns, it pulls you down to Earth. What is that, only 250 you say? Please go back to point 4 again, please.
- RISK DOES NOT DECREASE OVER THE LONG TERM!! That is the central message of this post/
- I am not against equity investing. This is only a caution to invest with the expectation of risk and not with the expectation of returns.
- Do not believe the nonsense about compounding in equity occurs over the long-term. There is no compounding in equity (or gold, or Bitcoin or a debt mutual fund)
- Returns from any market linked product depend on two things: (1) the period over which you stayed invested (SIP or lump sum does not matter) and (2) how well you managed risk during the investment period. What you see below are lump sum returns for unmanaged risk. Treat this post as a not-so-gentle reminder to recognise risks and manage them.
- And Please do not say, “SIPs will be better”. No, they will not – Dollar Cost Averaging aka SIP analysis of S & P 500 and BSE Sensex
- Why am I repeating myself when I have already shown the essential findings before? Because this study with about 1.5L return calculations is by far the most comprehensive I have done so far. And it never hurts to (a) be thorough and (b) provide a warning to a new group of readers.
- That said, most people who read this probably will not understand, or worse not want to understand just how risky unmanaged equity investments can be. People see what they want to see and worse take their few years experience of equity investing a bit too seriously. Anyways this analysis is a scratch that I had to itch.
A question I asked in Asan Ideas of Wealth yesterday: A man buys one unit of Sensex (let us assume index investing was possible then) just days before the Harshad Mehta scam broke on 30th March 1992 with the index at 4091.43 (arrows below). Over the next 25 years, he kept his unshakable faith in Equity and held on to his investment, no matter what. Finally, on 24th March 2017 with the index at 29421.40 (619% increase), he checks the annualized return he has got. What would be the result of this calculation? This is before dividends. A 1.5% to 2% can be added to the return due to dividends.
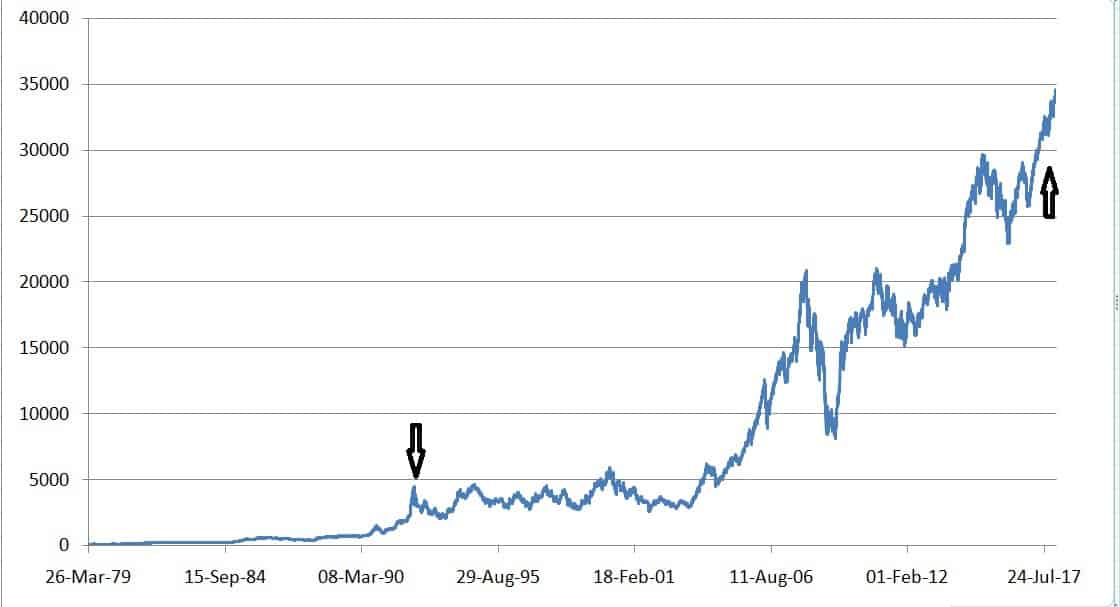
The answer is ~ 8% + 2% from dividends. Ony 10% returns from equity during a period when PPF rates was above 10% for half the time tells you that buying and holding will not always work. A 619% increase in the index does not take into account time! My only point is that
1) Do not enter equity markets without a risk management strategy (something more serious than asking a forum for views)
2) Do not enter equity markets if you do not know how to get out!
3) Do not assume equity will always deliver over the long term!!
What is a rolling return?
Suppose you have Sensex data from April 1979* to 12th Jan 2018.
* Official trading began only in the mid-80s. So the first few years is back-calculated and all risks may not be captured.
Now you can calculate a one-year return between
03 April 1979 to 02 April 1980
04 April 1979 to 03 April 1980
06 April 1979 to 05 April 1980
07 April 1979 to 07 April 1980
09 April 1979 to 08 April 1980
11 April 1979 to 10 April 1980
12 April 1979 to 11 April 1980
14 April 1979 to 15 April 1980
……
…..
06 January 2017 to 08 January 2018
09 January 2017 to 09 January 2018
10 January 2017 to 10 January 2018
11 January 2017 to 11 January 2018
12 January 2017 to 12 January 2018
That is a total of 8649 1-Y lump sum return data points. Similarly, we get 8404 2-year data points and so on
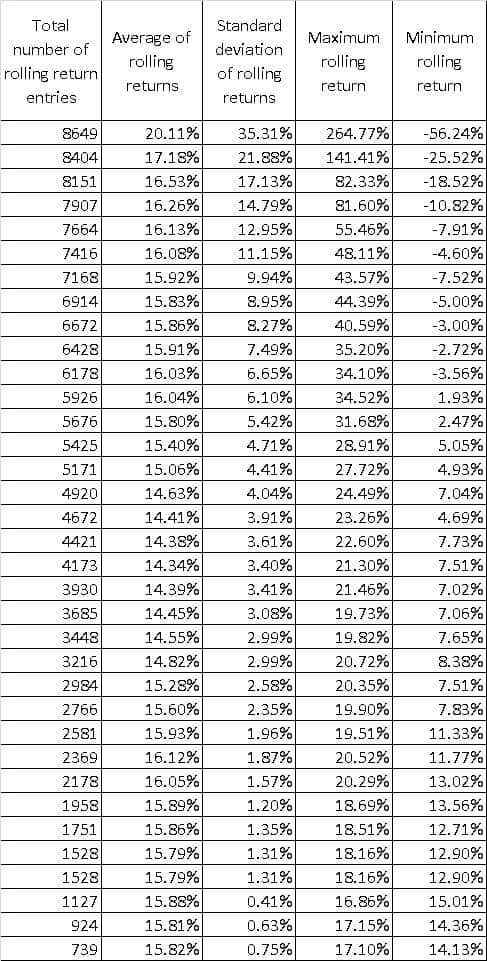
Beware of the average Sense returns: it means nothing
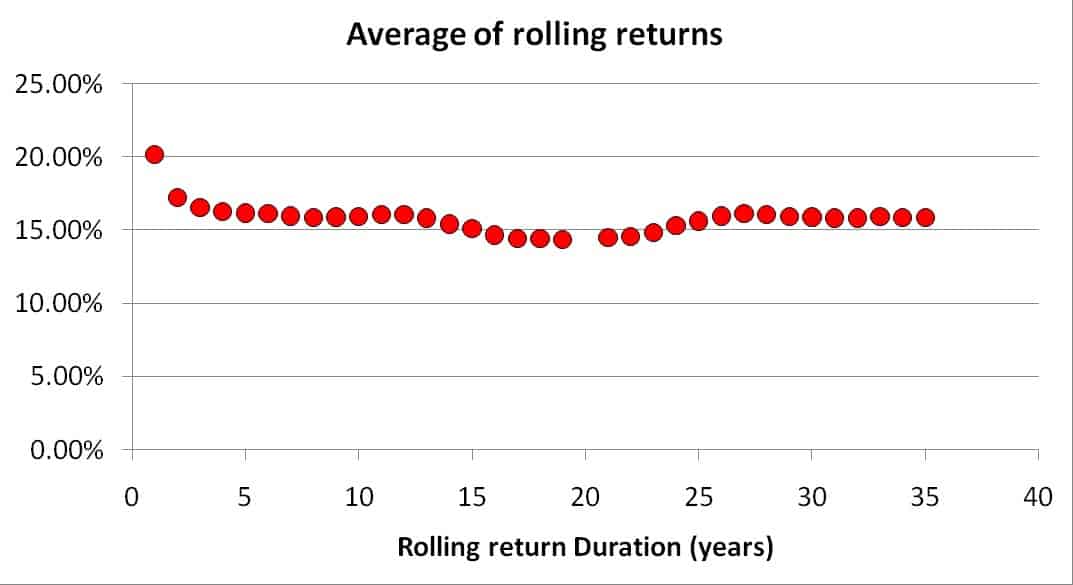
The average return is always about 15% (before dividends) from the Sensex. What is missing is the spread or risk. We would usually use the standard deviation, but the idea of average and standard deviation should only be used for bell curves (this is not!).
Sensex Returns: Max vs minimum returns
Instead, let us look at the maximum and minimum returns for each rolling return period.
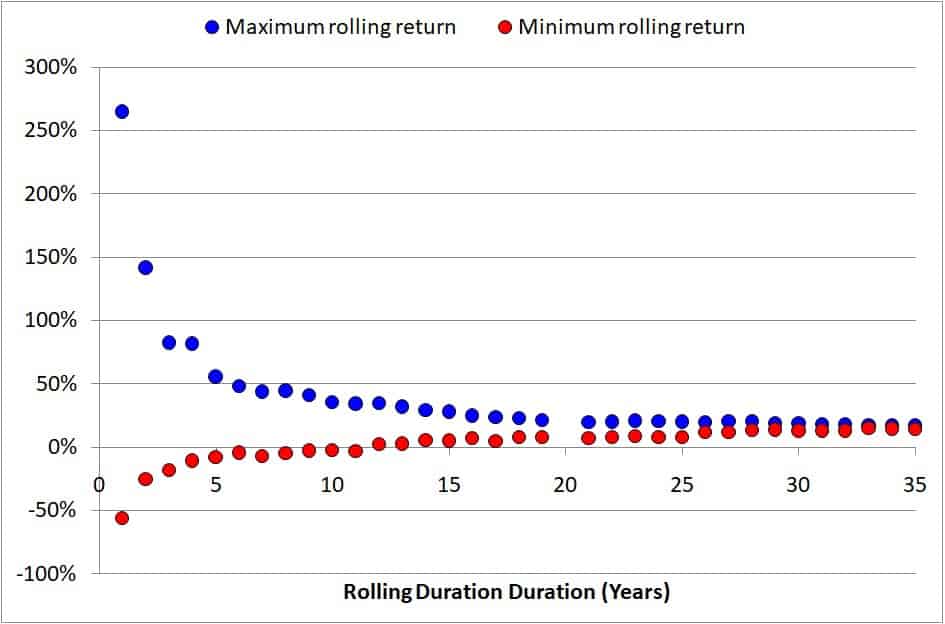
Not only does the gap between max and minimum returns decreases as the duration increases, the max return also decreases. New investors should not get excited about 35%, 45% XIRRs. It will soon vanish.
Let us look at the minimum return again
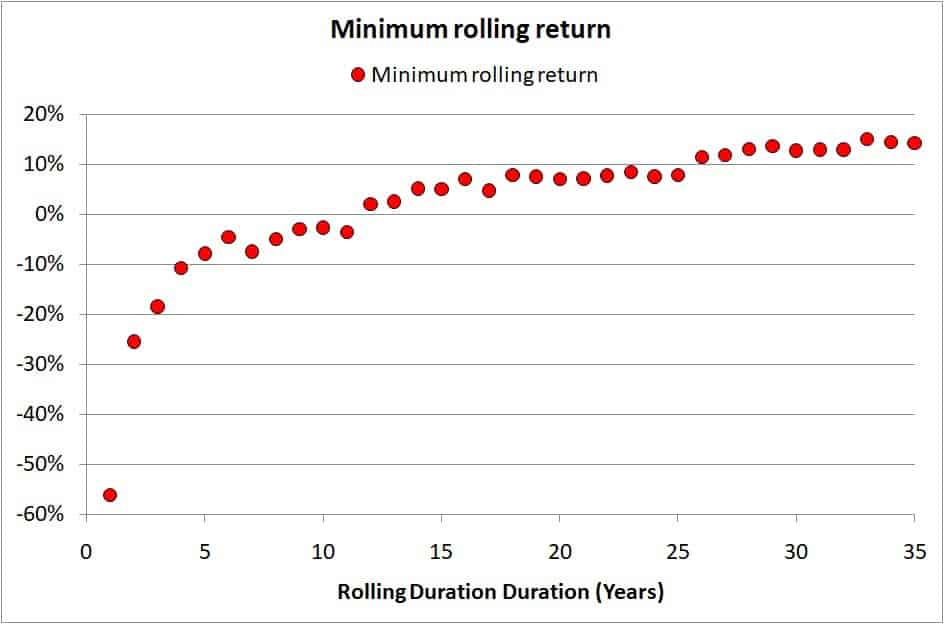
Notice that the minimum moves “up” in steps. This is probably due to the impact of the rolling return window moving past big market crashes.
Negative returns persist up to 11 years.
Single digit returns persist up to 20 years (even if we add about 2% due to dividends). Getting less than 10% returns after 20 years of investing is a reward disproportionate to risk. That is why it is important to recognise that holding on for the long term does not mean lower risk and/or better returns. An investment in equity should be actively managed: Simple Steps to De-risk Your Investment Portfolio
Do not assume that the probability of low returns is low. That is for an analyst to write about. As an investor, we must consider possibilities and not probabilities and protect ourselves.
Many incorrectly assume that I am against risk-taking. I am only against risk-taking where holding is the only strategy. Chances are that you will see some comments that do not get this point. I have not said anything new in terms of conclusions here, but I have said so with a much more rigorous analysis. Those who do not value rigour will fail to appreciate it and I am fine with it.
Sensex Rolling Returns Summary:
Do not take the average or standard deviation seriously. They are not valid. If you still wish to, read them as average +/- standard deviation. That is the standard deviation is the spread in returns for each distribution (see slideshow)
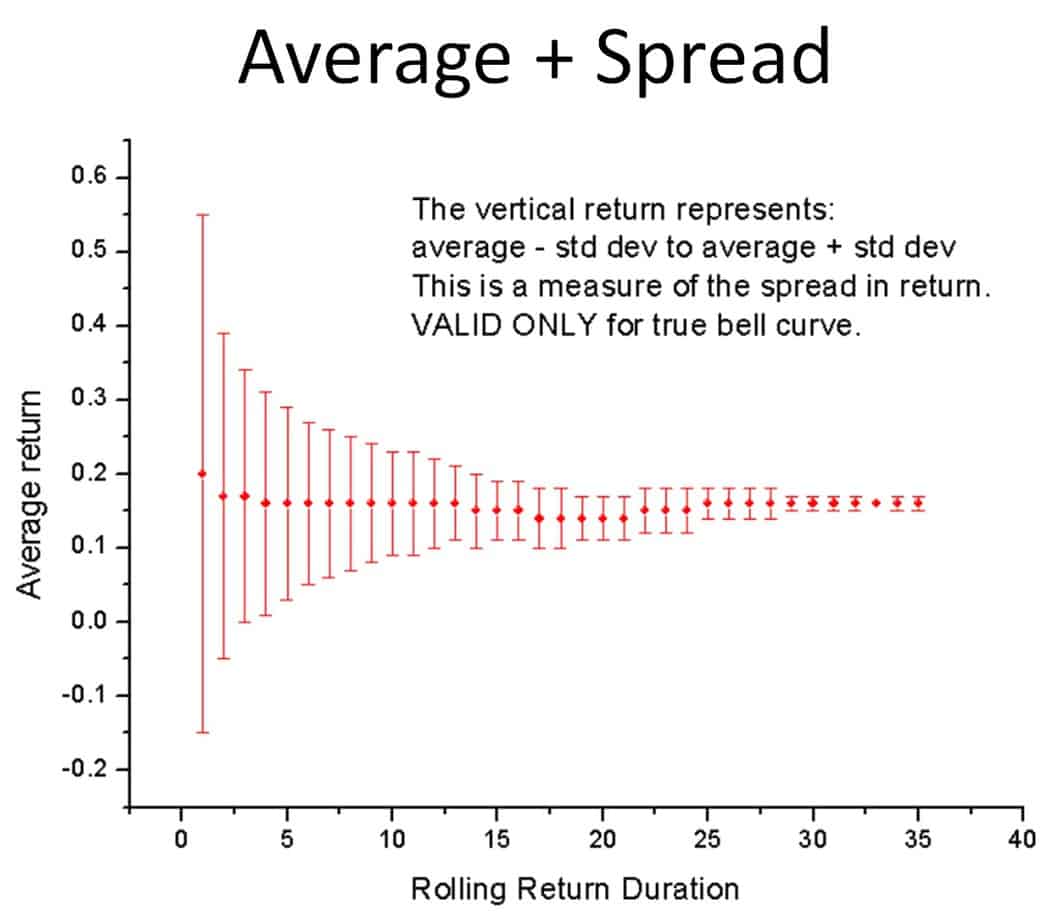
Warning: DO no assume risks decrease using this chart
Sensex Rolling Returns Charts: Slide Show
All the charts used to compile the above data can be found below. Please do stare at a few of them to get a visual understanding of risk.
What if I actively manage risk? Will lower risk result in better returns?
Verdict: sometimes!
Equity: Buying “High” vs Buying “Low”
Nifty 200 DMA: Buying High vs Buying Low
Buying “low” vs Buying “systematically”: Surprise, Surprise!
Buying “low” with “active” cash vs buying systematically: still a surprise!
It is unfortunate that many people assume lowering risk implies enhancing returns. Commonsense they say! Excuse me, but do not confuse imagination for common sense!
Beware: SIP will not reduce risks!
Please do not assume SIP is better. If the markets crash, your SIP will crash too.

Use our Robo-advisory Tool to create a complete financial plan! ⇐More than 3,000 investors and advisors use this! Use the discount code: robo25 for a 20% discount. Plan your retirement (early, normal, before, and after), as well as non-recurring financial goals (such as child education) and recurring financial goals (like holidays and appliance purchases). The tool would help anyone aged 18 to 80 plan for their retirement, as well as six other non-recurring financial goals and four recurring financial goals, with a detailed cash flow summary.
🔥You can also avail massive discounts on our courses and the freefincal investor circle! 🔥& join our community of 8000+ users!
Track your mutual funds and stock investments with this Google Sheet!
We also publish monthly equity mutual funds, debt and hybrid mutual funds, index funds, and ETF screeners, as well as momentum and low-volatility stock screeners.
You can follow our articles on Google News

We have over 1,000 videos on YouTube!

Join our WhatsApp Channel


- Do you have a comment about the above article? Reach out to us on Twitter: @freefincal or @pattufreefincal
- Have a question? Subscribe to our newsletter using the form below.
- Hit 'reply' to any email from us! We do not offer personalised investment advice. We can write a detailed article without mentioning your name if you have a generic question.
Join 32,000+ readers and get free money management solutions delivered to your inbox! Subscribe to get posts via email! (Link takes you to our email sign-up form)
About The Author
 Dr M. Pattabiraman (PhD) is the founder, managing editor and primary author of freefincal. He is an associate professor at the Indian Institute of Technology, Madras. He has over 13 years of experience publishing news analysis, research and financial product development. Connect with him via Twitter(X), LinkedIn, or YouTube. Pattabiraman has co-authored three print books: (1) You can be rich too with goal-based investing (CNBC TV18) for DIY investors. (2) Gamechanger for young earners. (3) Chinchu Gets a Superpower! for kids. He has also written seven other free e-books on various money management topics. He is a patron and co-founder of “Fee-only India,” an organisation promoting unbiased, commission-free, AUM-independent investment advice.
Our flagship course! Learn to manage your portfolio like a pro to achieve your goals regardless of market conditions! ⇐ More than 3,500 investors and advisors are part of our exclusive community! Get clarity on how to plan for your goals and achieve the necessary corpus no matter the market condition!! Watch the first lecture for free! One-time payment! No recurring fees! Life-long access to videos! Reduce fear, uncertainty and doubt while investing! Learn how to plan for your goals before and after retirement with confidence.
Increase your income by getting people to pay for your skills! ⇐ More than 800 salaried employees, entrepreneurs and financial advisors are part of our exclusive community! Learn how to get people to pay for your skills! Whether you are a professional or small business owner seeking more clients through online visibility, or a salaried individual looking for a side income or passive income, we will show you how to achieve this by showcasing your skills and building a community that trusts and pays you. (watch 1st lecture for free). One-time payment! No recurring fees! Life-long access to videos!
Our book for kids: “Chinchu Gets a Superpower!” is now available!


Must-read book even for adults! This is something that every parent should teach their kids right from their young age. The importance of money management and decision making based on their wants and needs. Very nicely written in simple terms. - Arun.Buy the book: Chinchu gets a superpower for your child!
How to profit from content writing: Our new ebook is for those interested in getting a side income via content writing. It is available at a 50% discount for Rs. 500 only!
Do you want to check if the market is overvalued or undervalued? Use our market valuation tool (it will work with any index!), or get the Tactical Buy/Sell timing tool!
We publish monthly mutual fund screeners and momentum, low-volatility stock screeners.
About freefincal & its content policy. Freefincal is a News Media organisation dedicated to providing original analysis, reports, reviews and insights on mutual funds, stocks, investing, retirement and personal finance developments. We do so without conflict of interest and bias. Follow us on Google News. Freefincal serves more than three million readers a year (5 million page views) with articles based only on factual information and detailed analysis by its authors. All statements made will be verified with credible and knowledgeable sources before publication. Freefincal does not publish paid articles, promotions, PR, satire or opinions without data. All opinions will be inferences backed by verifiable, reproducible evidence/data. Contact Information: To get in touch, please use our contact form. (Sponsored posts or paid collaborations will not be entertained.)
Connect with us on social media
- Twitter @freefincal
- Subscribe to our YouTube Videos
- Posts feed via Feedburner.
Our publications
You Can Be Rich Too with Goal-Based Investing
 Published by CNBC TV18, this book is designed to help you ask the right questions and find the correct answers. Additionally, it comes with nine online calculators, allowing you to create custom solutions tailored to your lifestyle. Get it now.
Gamechanger: Forget Startups, Join Corporate & Still Live the Rich Life You Want
 This book is designed for young earners to get their basics right from the start! It will also help you travel to exotic places at a low cost! Get it or gift it to a young earner.
Your Ultimate Guide to Travel
 This is an in-depth exploration of vacation planning, including finding affordable flights, budget accommodations, and practical travel tips. It also examines the benefits of travelling slowly, both financially and psychologically, with links to relevant web pages and guidance at every step. Get the PDF for Rs 300 (instant download)