In this edition of the reader story, Sahil presents his fourth financial audit.
Opinions expressed in reader stories do not necessarily represent the views of freefincal or its editors. We must appreciate multiple solutions to the money management puzzle and empathise with diverse views. Articles are typically not checked for grammar unless it is necessary to convey the right meaning and preserve the tone and emotions of the writers.
If you would like to contribute to the DIY community in this manner, send your audits to freefincal AT Gmail dot com. You can publish them anonymously if you wish.
Please note: We welcome such articles from young earners who have just started investing. See, for example, this piece by a 29-year-old: How I track financial goals without worrying about returns. We also have a “mutual fund success stories” series. See, for example, how mutual funds helped me achieve financial independence. Now, over to the reader.
How much do you earn, spend and invest?
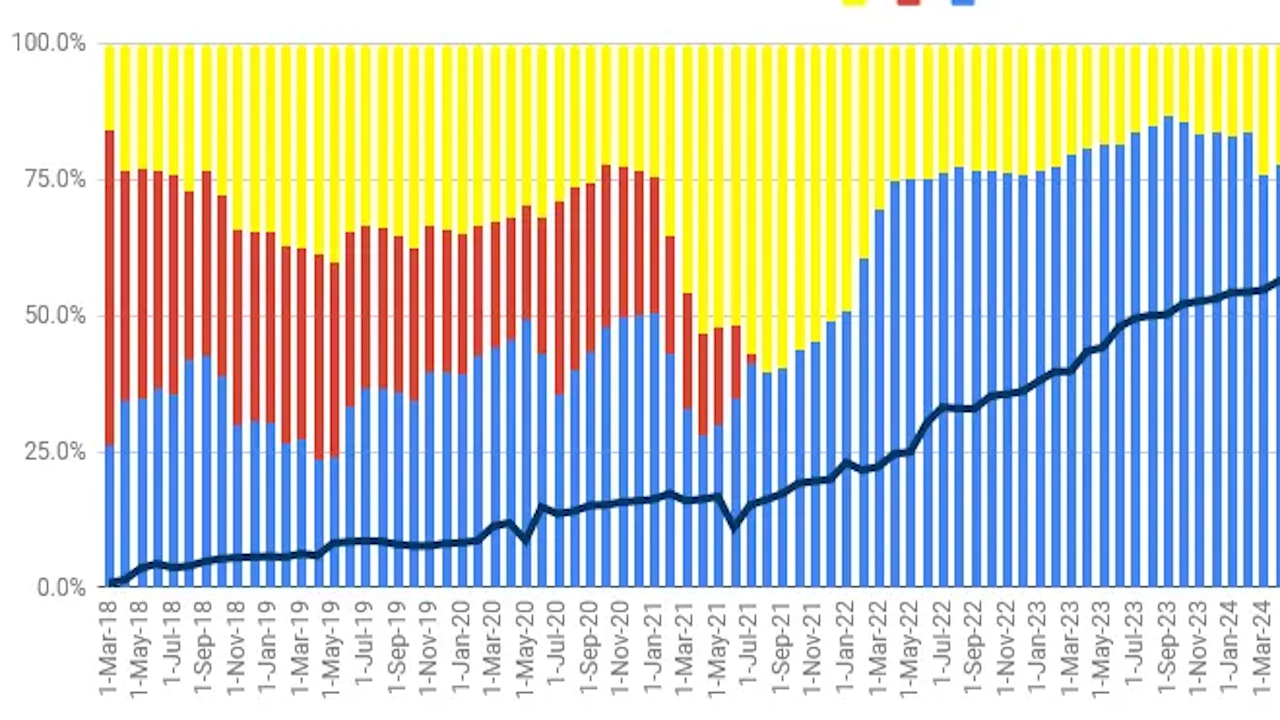
- The black line is the rolling 12-month income growth rate. In the last year, income has continued to increase, albeit at a slower pace compared to previous years
- I have been able to save/invest a lower % of income as compared to last year (blue line), and the remaining (yellow line) is expenses as % of income, which increased due to personal family celebrations. No EMIs (red).
- The graph is dated and will continue to be to ensure privacy
- Expenses were 62% higher than in FY25. It was a one-off, and I hope the expenses will be settled this year
Asset Allocation and Which asset to choose?
- Unified portfolio and no separate emergency fund
- I invested 60% of incremental savings in equity. If you exclude the PF contribution, this would be 65-70%. But equity% still increased by only 200 bps. My target is 50%. Hope to touch in FY27
- Just the month of Mar ’26 reduced the MF equity XIRR from ~17% to ~13%; one bad month can kill equity returns. Although in Apr’26, XIRR is back to ~17%
- Asset Allocation starting, ending and investment during the year is in the table below:
| FY25 end asset allocation | FY26 savings share | FY26 end asset allocation | XIRR as of 31st Mar 2026 | |
| Savings+ FD | 7% | 1% | 5% | 5-6% |
| Debt MFs | 15% | 16% | 15% | 6-7% |
| Debt (PPF+ EPF+ NPS-C/G) | 22% | 14% | 19% | 7-8% |
| Equity (MF+ Stocks +NPS-E) | 45% | 60% | 47% | ~13% |
| Gold (ETF +SGB) | 6% | 4% | 8% | ~35% |
| REITs | 6% | 5% | 6% | ~13% |
| Total | 100% | 100% |
Instruments to choose and their performance in FY26
- Debt MFs are primarily used to cover emergency costs, to purchase equity during down months such as Mar’26 and to maintain asset allocation. A mix of arbitrage, liquid and some GILTs
- Debt illiquid, i.e. EPF, PPF, NPS, should continue to go down to 15% from 19% currently. It was ~40% in FY20. These are the pillars on which the portfolio is made, but pillars shouldn’t occupy a lot of space, else aesthetics and performance go for a toss
- Gold has delivered an amazing return in FY26, i.e., 48% (time-weighted return). I wish I had more gold, but now it has run out too much
- REITs also did well in FY26, i.e., 20% (time-weighted return). Given the increasing interest rate environment, I feel FY27 will be okay for them, but I will maintain it to be around 6-8%
- Money saved: No FNO, No trading, No LIC endowment/ULIP plan
- The equity portfolio is mainly driven by
- Instruments- MFs: 86%, Indian stocks: 11% and NPS-E: 3%
- Geography diversification: India: 81%; China: 11%; US: 8% (via MFs)
- Cap diversification: ~10% small cap, ~20% mid cap and the remaining large cap. All foreign equity is counted as large cap
- MFs- PPFAS Flexi cap, Motilal S&P 500, SBI small cap, Invesco mid cap, Edelweiss Balanced advantage and Axis China (added in FY25). Though I also have some N50 and NN50, I use them only for lump sums, such as in Mar’26. No new Indian fund has been added in the last 48 months. While Indian MF returns were around zero in FY26, US MF gave 26% and China MF 34%, helping in outperforming N50TRI
- Stocks: 16 stocks compared to 12 last time. Stocks had a mix of Nifty stocks and new-age companies. FY26 return was minus (6%), so bad year for direct stocks. But Apr’26 has given me 14% return in 22 days, so next year should be good
- More on Equity MF performance as that is the more consequential part of the portfolio. I have beaten N50 TRI and NN50 TRI handsomely by 7-9% in FY26, way better than last few years. Part of this attribution goes to diversification, due to 20% US and China exposure, and to good returns from selected MFs (Invesco mid-cap and Edelweiss balanced advantage).
- Just for clarity and explanation on how to read the table below: My Equity MF portfolio Mar’26 last 12-month return (Apr’25-Mar’26) was +5.8% against -3.0% return for Nifty50 TRI
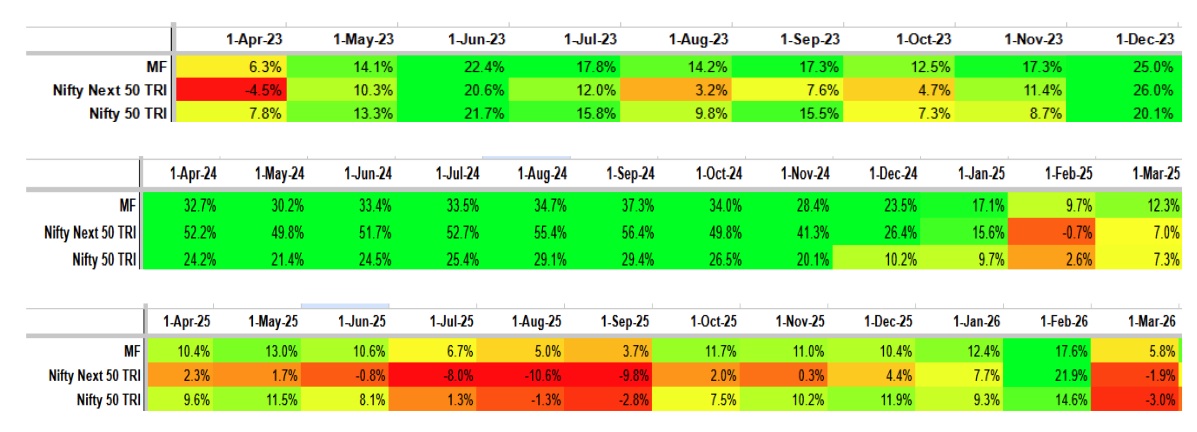
Here’s the rolling 12-month standard deviation of my equity MF over several months, compared with N50 TRI and NN50 TRI.
🔥Secure your future with our Robo-advisory tool trusted by over 3,500 investors and advisors. From effortless retirement planning to funding your children’s biggest dreams, turn your financial goals into reality. 🔥
Subscribe for money management solutions via email! (Link takes you to our email sign-up form) Join 32,000+ readers in our community.
👉 New Tool Alert! NaviPlan: A Privacy-Focused Multi-asset Tracker and Goal Planner 👈
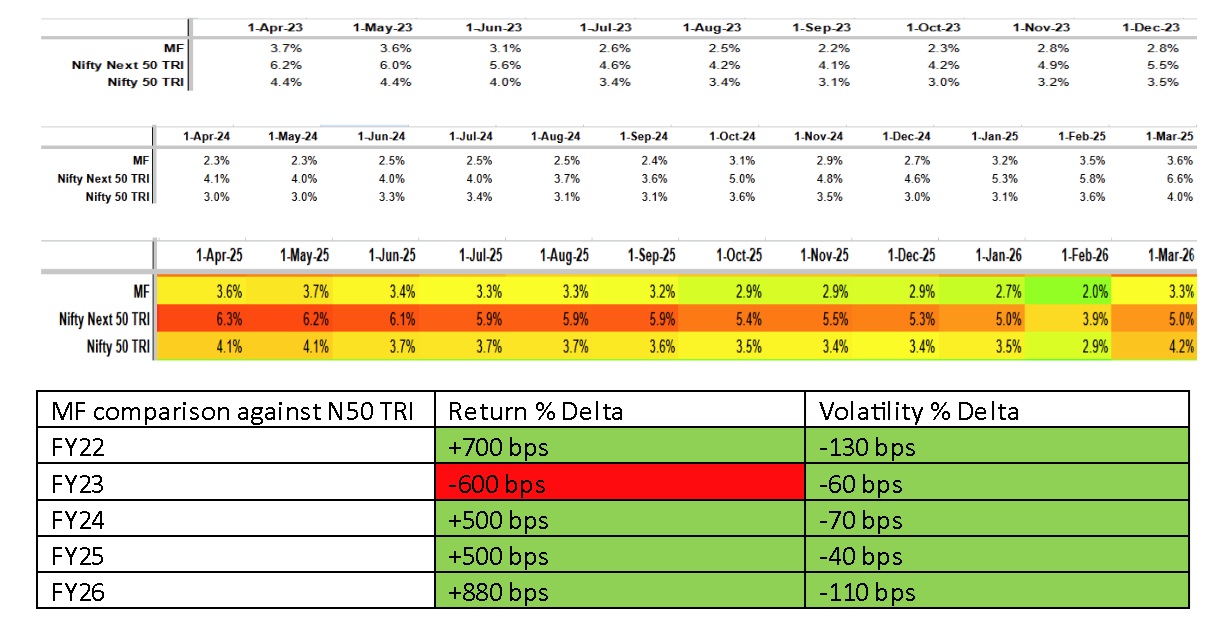
I have been able to beat the indices on both returns and volatility in FY26, the third consecutive year. This is the holy grail: lower volatility than Nifty while delivering higher returns. I am super happy with this result. Pls note the idea is to get lower volatility and not higher return %.
Net-worth (NW) and its measurement
Networth insights to bring the above all together
- In FY26, my net worth increased by ~33% (down from ~40% last year). ~70% of the NW growth is driven by salary savings and ~30% from asset returns (capital gains and interest). Over the next two years, I expect the contribution from asset returns to move closer to ~40%, although this remains contingent on equity performance.
| Savings contribution | Asset returns contribution | |
| FY23 | 91% | 9% |
| FY24 | 64% | 36% |
| FY25 | 72% | 28% |
| FY26 | 70% | 30% |
- Overall, till date, ~75% of my net worth is from human capital (savings contribution) and rest ~25% if from financial/asset returns. The latter number was <10% 4 years before
- I still don’t own a house. These numbers will dramatically change once home EMI starts
- I’ve crossed 10+ times (don’t want to share the exact number) of my annual expenses toward FIRE goals. I want to reach 40x by 2035
Reader stories published earlier:
As regular readers may know, we publish a personal financial audit each December – this is the 2024 edition: Portfolio Audit 2024: The Annual Review of My Goal-Based Investments. We asked regular readers to share how they review their investments and track financial goals.
- First audit: How Suhas tracks his MF investments and reviews financial goals.
- Second audit: How Avadhoot Joshi evaluates his investment portfolio.
- Third audit: How a single mom is on track to financial freedom
- Fourth audit: How Gowtham started goal-based investing & took control of his money
- Fifth audit: Why my financial independence & early retirement plans were postponed by four years
- Sixth audit: How Abhisek funded his marriage & is on track to financial freedom.
- Seventh audit: How Rohit’s early struggles defined his investment journey
- Eighth audit: Why my investments are still on track despite job loss and lower income.
- Ninth audit: How a retirement planning calculation scared me to take action
- Tenth audit: I made several investment mistakes but have turned my life around.
- Eleventh audit: My net worth doubled in the last financial year, thanks to patient investing!
- Update: How I achieved investing nirvana.
- Twelfth audit: My financial journey: from novice to goal-based investor.
- Thirteenth audit: My journey: from a negative net worth to goal-based investing.
- Fourteenth audit: From Fixed Deposits to Goal-based investing in MFs.
- Fifteenth audit: My 10-year financial journey – mistakes made and lessons learnt.
- Sixteenth audit (part 1): How I achieved financial independence without mutual funds or stocks.
- Sixteenth audit (part 2): Lessons from my financial independence journey and future investment plans.
- Seventeenth audit: How I plan to achieve financial independence and move to my native place
- Eighteenth audit: I used the current bull run to reduce my mutual funds from 14 to 4!
- Nineteenth audit: How a conservative investor created his financial plan
- Twentieth audit: I plan to achieve financial independence by 46; this is my master plan
- Twenty-first audit: I have made many investment mistakes but am on course to financial independence by 45.
- Twenty-second audit: I felt worthless six years ago but have achieved financial stability today
- Twenty-third audit: My financial journey was directionless until age 40: this is how I made up for lost time
- Twenty-fourth audit: Why I increased equity MF investments by 275% and reduced PPF contributions.
- Twenty-fifth audit: How I track financial goals without worrying about returns
- Twenty-sixth audit: I am 24 and started investing 1Y ago, but what am I investing for?
- Twenty-seventh audit: How we plan to achieve a retirement corpus 50 times our annual expenses.
- Twenty-eighth audit: I thought equity investing was a gamble, but now I aim to hold 60% equity for retirement
- Twenty-ninth audit: My journey: From 5 lakhs in debt to building a corpus worth six years in retirement
- Thirtieth audit: My investment journey: From random purchases to a goal-based portfolio
- Thirty-first audit: My investment journey: from product-driven to process-driven
- Thirty-second audit: How a young couple is trying to balance travelling and investing
- Thirty-third audit: My journey: From Rs. 30 bank balance to financial independence
- Thirty-fourth audit: Our journey: From scratch to a net worth of 18 times annual expenses.
- Thirty-fifth audit: From a net worth of Rs. 6000 to auto-pilot goal-based investing
- Thirty-sixth audit: How I retired from corporate bondage at 46, two years ago!
- Thirty-seventh audit: How I learnt to keep it simple and build a net worth 19 times my annual expenses
- Thirty-eighth audit: How Abhineeth plans to achieve financial independence and build a house.
- Thirty-ninth audit: How Sahil plans to achieve financial independence by efficient tracking
- Fortieth audit: My Journey to a Ten Crore Portfolio
- Forty-first audit: Burdened with debt for several years, I am now aggressively investing in equity
- Forty-second audit: From Engineer to Librarian after Financial Independence and Early Retirement (FIRE)
- Forty-third audit: I lost six months’ income in F&O and ditched it for systematic investing
- Forty-fourth audit: My retirement plan to handle the harsh realities of the IT industry
- Forty-fifth audit: My investment journey: mistakes, 10 years of MF investing and recovery
- Forty-sixth audit: My MF portfolio is worth six crores despite multiple mistakes
- Forty-seventh audit: Saving, Investing, and Running Marathons: My 25-year Journey to Financial Independence
- Forty-eighth audit: Never Too Late to Start: How I Became Financially Savvy at 40
- Forty-ninth audit: My Investment Journey to a net worth 29 times my annual expenses
- Fiftieth audit: How I audit my portfolio without tracking returns
- Fifty-first audit: Financial Lessons Learned During and After a PhD
- Fifty-second audit: Investment & Financial journey of a 23 year old
- Fifty-third audit: The system I use to draw income and spend after retirement securely
- Fifty-fourth audit: From Start-Up Employee to Millionaire: A Success Story of Resilience and Smart Investing
- Fifty-fifth audit: 25-Year-Old Software Engineer’s Investment Journey: From Stocks to Mutual Funds and Beyond
- Fifty-sixth audit: Crossing the Million Mark: Our Journey to the First Crore
- Fifty-seventh audit: Navigating Market Volatility: How an IT Professional Transformed His Investment Approach for Retirement
- Fifty-eighth audit: How Sahil achieved a 10X retirement corpus by efficient portfolio tracking
- Fifty-ninth audit: How I achieved financial freedom by 45 without onsite assignments or ESOPs
- Sixtieth audit: Building Wealth on a Government Salary: Lessons Learned
- Sixty-first audit: Minimalism, Index Funds, and Staying Calm: My Investing Journey at 28
- Sixty-second audit: Building Wealth and Breaking Barriers: How Swati Took Control of Her Financial Future
- Sixty-third audit: My financial journey: How I missed the Compounding Bus!
- Sixty-fourth audit: My MF investment journey: From thematic funds to a 3-fund portfolio
- Sixty-fifth audit: From Debt to ₹1 Crore Liquid Net Worth: My Journey of Financial Awareness.
These published audits have had a compounding effect on readers. If you would like to contribute to the DIY community in this manner, send your audits to freefincal AT Gmail. You can also publish them anonymously.